Approach and Process

Having an approach to what the company considers critical is particularly important: you will focus on what is important for them in terms of process. What would be the performance objective: the duration of the process, the maximum response time of the interaction.
You will prioritize the scenarios and then prepare them. If you have the right scenarios then you will work on the right aspects of preparations: that is to create test scripts, if you first need specific data in the system (this means the need for a data creation script).
If you have a set of scenarios that will require power, this will mean a specific environment. And as you have done the preparation: you have the right scenarios and the right test scripts, the environment is ready you can then run the tests, Analyze the results, and then iteratively adjust the system until you have reached the performance targets.
If you do not set these goals, you will never be when you stop. Once all the objectives are achieved you will be able to confirm that the solution will be able to perform the workload requested by the company.

The first step when we need to start the optimization process is to narrow down topics and prioritize them so that we know where we will focus our efforts: A blocked process, a batch that takes days to run instead of hours. The goal is often to work in quick win mode. To find out where we waste the most time.
Once the analysis is completed, we will solve the problem either temporarily or permanently and produce a fix for example: Microsoft and ISV delay must be considered in the implementation of this patch and development efforts to develop patches should be planned.
This patch will be subsequently obviously evaluated for validation and then once validated it will be deployed on production.
Remember that performance tuning is an iterative process that occurs throughout the life of your information system.
Tools for performance
LCS Environment Monitoring
Activity monitoring: gives a timeline of the system usage and user activities, shows what you or another user was doing during a specific time period and the trend of SQL usage.
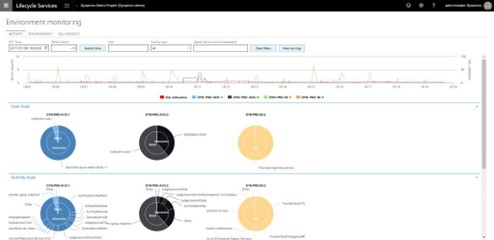
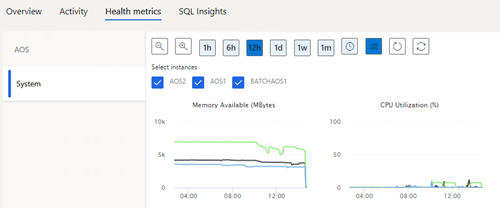
Health Metrics: Displays critical metrics such as connection trends but also CPU, memory used for example, AOS load, SQL locks, long queries, user sessions, events.
SQL insights: Includes advanced SQL troubleshooting tools to enable performance analysis.
- Live View: Displays execution instructions and blocking instructions.
- Queries: list of predefined queries used to retrieve metrics on demand
- Actions: list of predefined actions to mitigate issues in sandbox and production environments: the end of a blocking instruction.
- Performance Metrics: the most expensive queries that were executed in the system during the selected period, according to the logical I/O, number of executions, duration, CPU time.
- Index Analysis: aggregated information on indexes and tables, based on user analyses, user searches, user updates and number of rows.

Performance Tests Tools
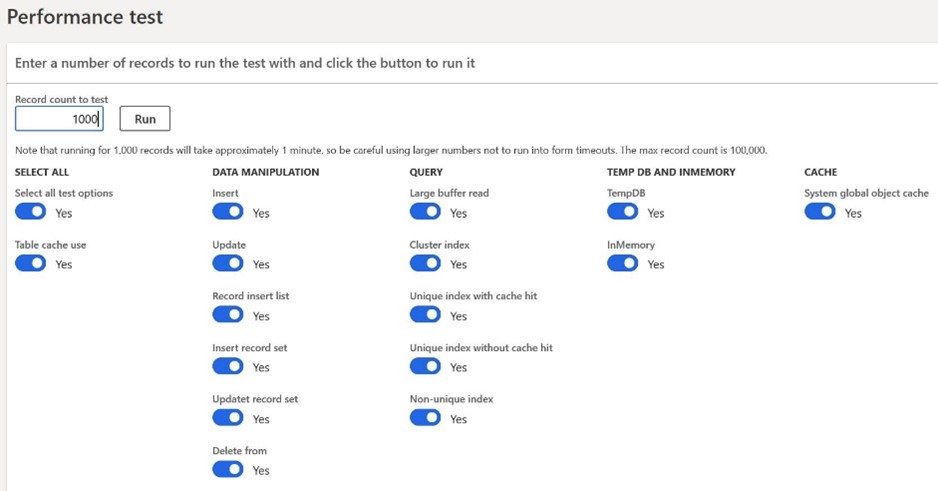
The Performance Test tool is a tool available from D365 F&O in the System Administration > Periodic Tasks > Run Performance Test module.
This tool allows to run quite simple, controlled, and reproducible tests that will give an indication on the duration of specific micro-operations related to data retrieval and modification.
This allows you to configure a number of tests to be performed and the number of times these tests are run. This consists of performing tests related to database access (insert update select and delete) as well as data access and manipulation in the tempdb, in memory tables and AOS cache, and to perform all these operations as many times as specified.
It is possible to test indexes with/ without caching combination. This tool is useful for a first-level performance test and can highlight issues that require further investigation.
Optimization advisor workspace
Optimization advisor enables operational users to identify and implement opportunities to optimize their business processes and D365 implementation.
Architecture: optimization advisor runs on AOS as a batch. Consists of a list of rules (standard or specific) that can perform diagnosis and automated actions. Each rule has its own recurrence, its own execution time, can present opportunities and the impact in translated labels is visible only to users responsible for each business process.
User experience: In the workspace optimization advisor, the user can see relevant opportunities to get details to quantify expected impact, take actions.
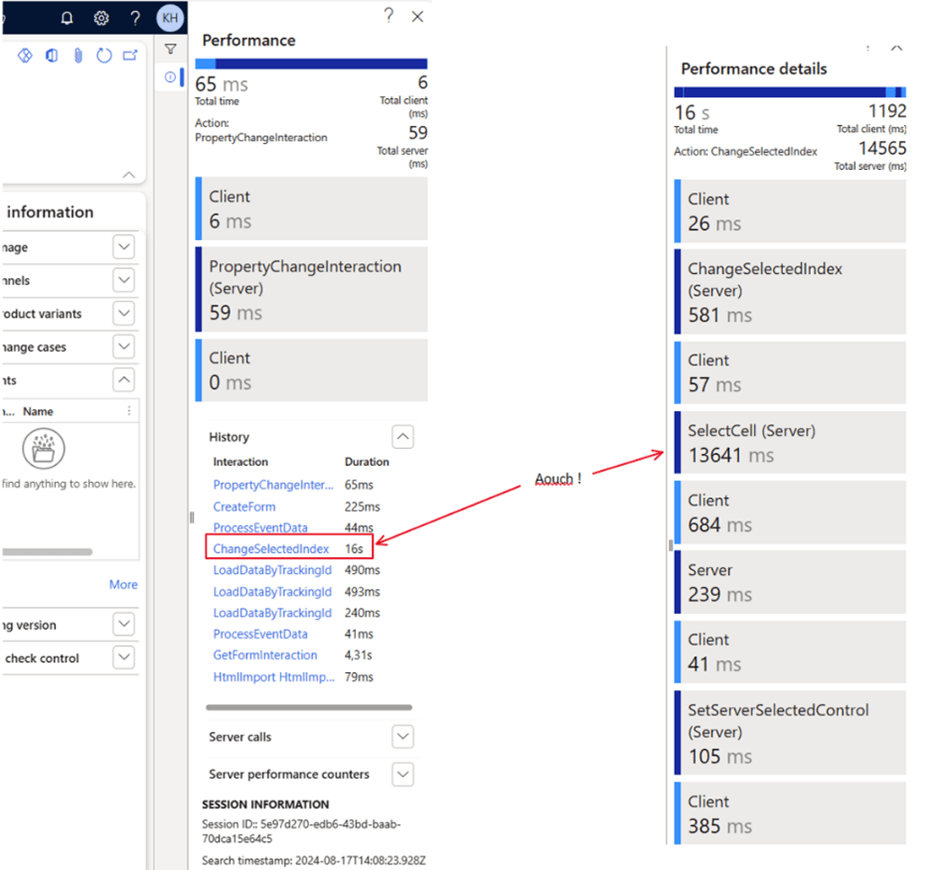
Performance Timer
Open the web page with debug setting: https://yoursite.cloud.test.dynamics.com/en/? cmp=USMF&debug=develop
The Performance Timer tool allows you to monitor the duration of specific actions within the system. It is a valuable tool to determine if performance issues are related to particular tasks, forms, or processes.
Using the performance timer, you can get a clear understanding of system behavior and identify specific steps or components that are not working properly. This allows you to focus your troubleshooting efforts and avoid the needle in a haystack approach.
Trace Parser
Trace parser is a particularly important utility that helps developers to debug an application. It shows each SQL statement, and each method called by application followed by the call code and stack.
- In the “SQL” tab, you can see each SQL statement and the method from which it was called with all the call stack code.
- In the X++ tab you can see all the methods used by the application with its call stack. There are many other data analyses such as the “Count” column that tells you how often the method was called.
- In the “Call Tree” tab, you can see all the methods used in a tree. The tree shows the hierarchy of methods and the relationship between them.


Leave a comment