- Step 1: Check the Azure status
- Step 2: Collect detailed information from users
- Step 3: Use Life Cycle Services (LCS) for telemetry data
- Step 4: Reproduce the problem
- Step 5: Perform a simple F12 network analysis
- Step 6: Run a performance timer in D365 F&O
- Step 7: Trace Parsing for further analysis
- Step 8: Fixing Issues
- Some additional reflections
It is common to hear during user tests or later when the system is live the following sentences: «The system is slow today. », “Nothing works!”
Performance in Dynamics 365 is a critical aspect for users and system managers. For end users, mediocre performance can be frustrating, while system owners face challenging in identifying and resolving performance issues.
Below is a checklist that outlines the steps to follow to diagnose and discuss with users about sudden performance issues.
This is a step-by-step guide to find the root cause of performance issues and take appropriate action.
Step 1: Check the Azure status
In case of sudden slowdowns, you can perform some quick initial checks regarding the Azure status:
- Microsoft health status: https://status.cloud.microsoft/ provides a summary of the state of Microsoft Cloud
- Azure speed test: https://azurespeedtest.azurewebsites.net/ allows you to see current ping times to Microsoft data centers.
- Azure State: visit the Azure State page to see if there are any global issues that affect performance.
- Power Platform: See the Power Platform help and support for reports on service status and known issues.
If these resources reveal global problems, it is likely that the problem is already being addressed. Let your users know that Microsoft engineers are working on the problem.
Step 2: Collect detailed information from users
Collect more specific details from the user or users experiencing the issue.
Key questions to ask:
- What were you doing when the performance issue occurred?
- Are other users facing the same problem?
- Is it related to a specific form or process?
- Is the problem constant or random?
- Can you record a short video to illustrate the problem?
- Can you provide copy/paste session information (activity ID, session ID, AOS name)?

This information will allow you to target the problem and verify it with LCS environment monitoring.
Step 3: Use Life Cycle Services (LCS) for telemetry data
Once you have excluded the issues at the Azure part, the next step is to analyze the performance data of your environment https://learn.microsoft.com/en-us/dynamics365/fin-ops-core/dev-itpro/lifecycle-services/monitoring-diagnostics
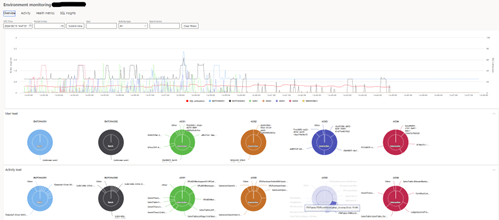
- Environmental monitoring: in LCS, go to the Environmental Monitoring to get an overview of your system’s status.
- Check SQL usage: look for persistent peaks in SQL usage that show performance bottlenecks.
- Analyze AOS performance: check if any of the Application Object (AOS) servers are experiencing difficulties.
- SQL Insights: search for heavy requests or blockages in the system. This will help you identify ongoing processes that are causing delays.

- Review activity logs: check for long-term queries or errors in telemetry data.
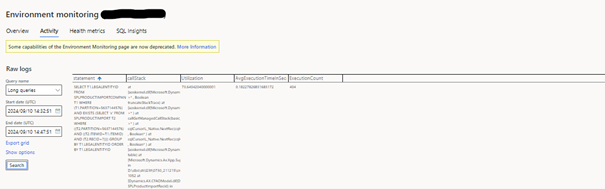
At this stage, you are looking for general indicators of stress or system inefficiency. The LCS telemetry will be gradually deprecated in the coming weeks to be replaced by the Application Insights.
Step 4: Reproduce the problem
Once you have gathered the preliminary information and checked the system’s telemetry, it is essential to try to reproduce the problem yourself. This is an essential step as it allows you to confirm the problem and analyze it in a controlled environment.
Why it is important to replicate the problem:
- Validation: Checking that the problem can be recreated ensures that it is not an isolated user-specific problem, but rather something systematic that can be studied in more detail.
- Visibility: Being able to see the performance issue firsthand will give your insight into how the system behaves under the problematic conditions, allowing for further analysis.
- Communication: if you plan to pass the problem on to developers or Microsoft support, showing that the problem can be replicated provides a solid starting point for others to solve it.
Steps to replicate the problem:
- Request access to the user’s system or environment: if you do not have access yet, ask for permission to log into the user’s environment. Make sure you use the same permissions and roles as the user to avoid discrepancies.
- Follow the user’s steps: once logged in, replicate the exact actions performed by the user when the problem occurred. This includes:
- Navigate through specific forms.
- Execution of reports or transactions.
- Perform specific searches or filter data.
- Use telemetry for help: if the user has provided session information (e.g., activity ID, session ID, AOS name), use them to find the time of the problem and see if logs or telemetry queries can help reproduce it.
- Consider different scenarios: Sometimes performance issues only occur under certain conditions. Evaluate different scenarios to see if the problem persists:
- Load variation: does the problem only occur when multiple users are connected and performing heavy tasks at the same time?
- Data-specific issues: Does the issue occur when working with certain records or larger datasets?
- Time-sensitive issues: are there specific times of the day when the issue occurs (for example, during peak hours)?
- Simulate a clean environment: if you are unable to replicate the problem directly, try evaluating the same functionality in a non-production environment (for example, a test environment or sandbox) to see if the problem persists. Differences in performance between production and non-production environments can often indicate configuration or data problems.
What to do if you are unable to reproduce the problem:
- Ask for more details: if you still cannot reproduce the problem, contact the user, and ask them for more context or detailed steps. They may have forgotten to provide key details that could help identify the problem.
- Collaborate with other users: ask other users if they have the same problem. If the issue is user-specific, it may be related to personalization, permissions, network connections or local device configurations.
Document your results:
Whether or not you succeed in replicating the problem, it is essential to document your findings. This documentation will be useful if you are passing the issue to another team, for example:
- A support ticket with Microsoft.
- An internal report to the development or IT teams.
- Communication with the user concerned to manage expectations.
By trying to replicate the problem yourself, you not only confirm the problem but also reduce potential causes, making it easier to troubleshoot or escalate the problem with confidence.
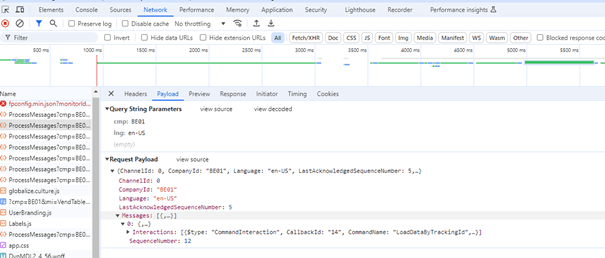
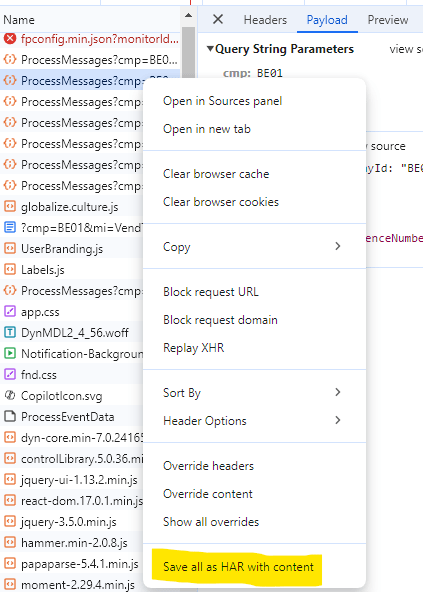
Step 5: Perform a simple F12 network analysis
Using the developer tools in Chrome or Edge (F12), perform a network scan:
- Load time tracking: analyze the loading time of various user interface elements.
- Search for cryptic delays: look for traces that take an unusually long time.
You can save network data (such as header, payload, and response times) for further analysis or support cases with Microsoft.
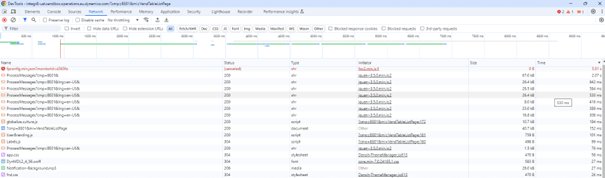
You can then save/save the header, payload, and response times. This will give you more clues and information.
If you can “locate” the exact menu item when the performance issue occurs, also save a HAR file as this may be required later if you need to create a support folder with Microsoft.
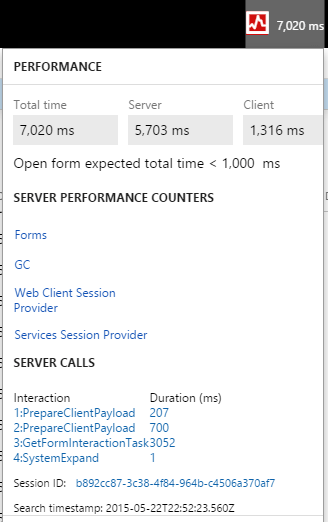
Step 6: Run a performance timer in D365 F&O
After trying to replicate the problem and gathering more information, the next step is to use the performance timer in D365FO. This will help you identify performance bottlenecks that may occur in the user interface.
What is the performance timer? https://learn.microsoft.com/en-us/dynamics365/fin-ops-core/dev-itpro/perf-test/performance-timer
The Performance Timer tool allows you to monitor the duration of specific actions within the system. It is a valuable tool to determine if performance issues are related to tasks, forms, or processes.
Steps to run the performance timer:
- Enable performance timer: in D365FO simply add &debug=develop to the URL you are using. This will activate the developer mode, which includes the performance timer. An icon that you can click to see the timers should appear.
- Run process: Now that the performance timer is enabled, run the process that causes performance issues (for example, browsing forms, running reports, or completing a transaction).
- Analyze results: the performance timer displays detailed information on the time required for each step. Focus on processes that are showing abnormally high times as they may indicate where the problem is.
- Save data: Save the timer output, which may include SQL query times, network delays and calculation delays. This data will be useful if the problem needs to be reported to developers or support teams.
Why use the performance timer?
Using the performance timer, you can get a clear understanding of system behavior and identify specific steps or components that are not working properly. This allows you to focus your troubleshooting efforts and avoid the needle in a haystack approach.
Step 7: Trace Parsing for further analysis
Once you have exhausted surface checks, it is time to go further by using trace analysis. This step will give you a detailed view of what is happening behind the scenes, for example which SQL queries or X++ code contribute to performance degradation.
What is trace parsing?
Trace parsing involves the generation and analysis of detailed logs of system activity, focusing on SQL execution times, computation times and overall process flows. This is usually a task for experienced developers familiar with X++ and SQL.
Steps for effective trace parsing:
- Enable Tracing: Enable tracing in the specific environment where the performance issue occurs. Make sure to limit the trace to only a few seconds when the problem occurs, as traces can quickly become exceptionally large and difficult to manage.
- Analyze the trace file: once the trace is complete, you will receive a detailed log of system events including:
- SQL Execution time: identify the duration of individual SQL calls.
- Compute time: understand the amount of CPU time consumed during specific processes.
- Call stack: view the entire process flow, showing methods and queries running.
Example: a healthy SQL query can take less than 25 milliseconds, but a problematic query can take several seconds, indicating where optimization is needed.

- Identify bottlenecks: review the top 5 X++ calls and requests. These can often be related to the main contributors to performance issues. Look for patterns such as repeated heavy requests or inefficient code paths that could slow down the system.
What to do if the trace is not conclusive:
If no obvious bottleneck is detected, you may be facing an aggregate performance problem caused by the cumulative effect of many small efficient processes. This type of problem can be particularly difficult to solve, as it requires rethinking larger architectural elements.
For example, if performance issues arise from standard code, extensions, or customizations, it can take weeks to fully resolve, especially if multiple layers of custom code are involved.
Step 8: Fixing Issues
Once you have identified the root cause of the performance problem through telemetry, replication and trace analysis, the next step is to involve the appropriate resources to resolve it.
- Determine Responsibility:
- If the problem is caused by a Microsoft code, open a support file with Microsoft.
- If the problem is with an ISV solution, contact the ISV for support.
- If custom partner extensions are responsible, contact the team that developed these extensions.
- Check the version and patches: make sure your environment is running the latest software version, as many performance issues are fixed in subsequent patches or patches. Check the LCS patches and release scheduler for upcoming features or patches that could resolve the issue.
- Evaluate parameters and configurations: performance can often be related to configurations. Check the system settings, as activating too many features or processes can slow performance. Disable unnecessary options to streamline the operation of the system.
- Optimize data management: Check if any transactional or obsolete data (such as completed sales orders or old inventory/WMS transactions) accumulates in the system. Regular archiving of old data and maintaining a clean system can significantly improve performance.
- Community support: please contact the wider Dynamics 365 community. Platforms such as Yammer, community forums often provide valuable information and workarounds shared by other users who have encountered similar issues.
Some additional reflections
Once the root cause of the performance problem is identified and addressed, there is usually a question as to who should pay for the processing of this performance optimization and who is responsible. The fundamental problem is not the bug/code/data that caused the performance issues. No developer, partner or Microsoft can provide perfect code that manages all combinations of complexity. I argue that in the project there should be more investment in quality procedures and customer testing of the used combinations of system and data. Chapter 14 of the implementation guide gives a particularly good overview of how to execute the test strategy.
A recommendation would be to allocate a substantial part of the project implementation for testing and training.
- Unit tests and integration tests: 15%
- User acceptance tests (UAT): 15%
- Performance and safety tests: 5% and 15% for training
- End-user training: 5%
- Administrator and power-user training: 5%
- Development of training materials: 5%
The process of solving performance problems is complex and involves a lot of knowledge from many parties. But we have access to many tools, processes, and telemetry to identify the root cause of the problem. It may take some time, but the more precise and detailed we are, the faster a problem can be solved.
Also keep in mind that D365FO system is complex. The D365FO standard is estimated at about 27.7 million lines of code and 430,000 methods. To this we must add the whole of the lines produced by the ISV and the specific code created: It is a lot of complexity, and the result is that performance problems will arise from time to time.
Some processes such as price calculation are slow (unfortunately, you must get used to it)
Customizations are often the cause of performance problems, but have you given enough time to the developers to finalize their development properly and have you assessed them enough.
The scaling of the PROD environment is closely related to license management and the subscription estimate file. Many heavy transactional integrations and automation combined with a limited number of user licenses are a recipe for performance problems.
Finally, to finish on a humorous note: D365FO allows you to enjoy well-deserved coffee breaks. This is not a bug: it is a feature designed to give you more time to think. It also teaches you the virtues of mindfulness and patience.

Leave a comment