- Introduction
- What is Application Insights
- Gather monitoring needs
- Understanding the business objectives
- Identify the main stakeholders
- Define use cases
- Determine the metrics and KPIs
- Establish alert and notification requirements
- Take into account data retention and confidentiality
- Assess visualization needs
- Aligning with organizational governance
- Document requirements carefully
- Use of monitoring during the project life cycle
Introduction
The monitoring and telemetry feature is a direct point-to-point integration between an instance of D365 Finance and the Azure Application Insights destination. Azure Application Insights is a service hosted on Azure that collects telemetry data for analysis and presentation purposes.
This feature provides the following services:
- Collect telemetry data to get information about how the application is used.
- Allow developers and administrators to collect additional information in diagnostic scenarios.
- Improve the efficiency of problem detection, diagnosis and troubleshooting, and thus reduce the overall resolution time.
- Enable proactive alerts with standard features provided by Azure Application Insights.
Microsoft does not collect telemetry data issued for operational support or reporting purposes. This data is managed by the client and remains in the client’s tenant.
Why monitoring is essential:
- Early detection of incidents: monitoring allows you to detect problems, such as latency peaks, integration failures or transaction anomalies, before they escalate and impact users.
- Performance optimization: telemetry data reveals trends in application performance, helping you identify bottlenecks or inefficient processes that can degrade the user experience.
- Proactive response: exploitable alerts allow teams to react quickly, often avoiding failures visible to users and preserving trust in the system.
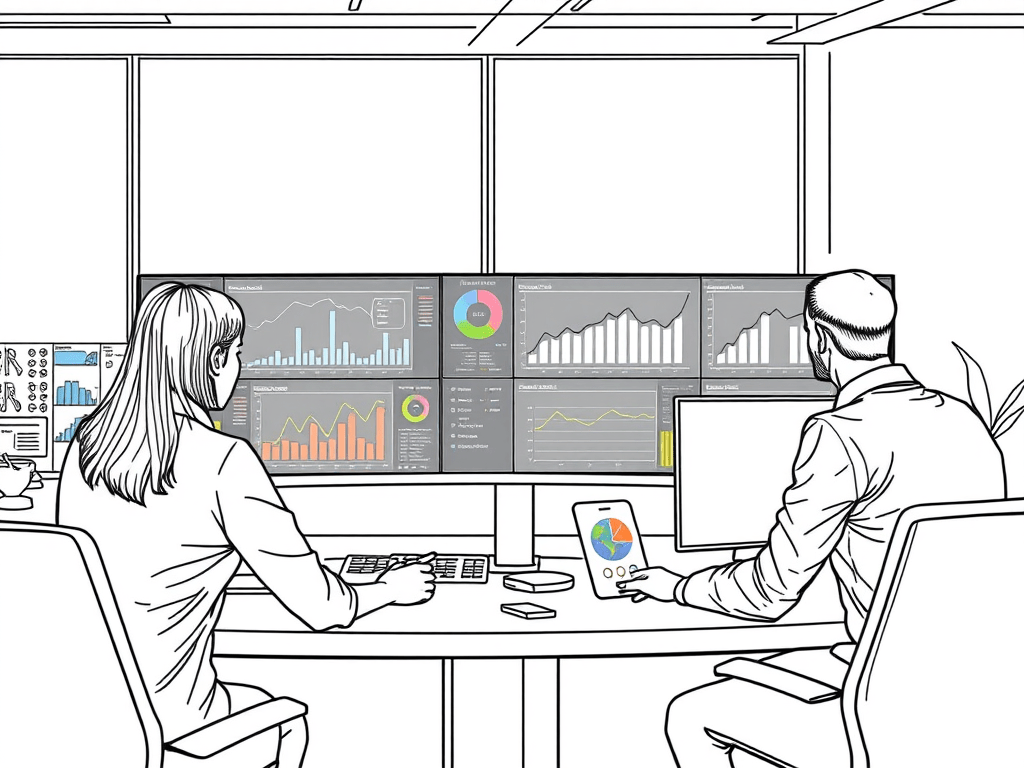
What is Application Insights
Introduction
Monitoring Dynamics 365 applications is a strategic issue to ensure their performance and reliability. Microsoft offers an efficient solution for this supervision: Application Insights. Azure Monitor Application Insights is an OpenTelemetry feature of Azure Monitor that provides application performance monitoring (APM) . This tool, integrated with Azure Monitor, allows in-depth analysis of application telemetry, identification of performance issues and error diagnostics for web applications.
Application Insights is an essential tool for performance tracking and error monitoring in Dynamics 365. It allows:
- Proactive monitoring of applications
- In-depth analysis of user interactions
- Fast detection of performance issues and errors
- Customization of dashboards to visualize critical data
Integration with Azure services enables efficient monitoring and diagnostics, enhancing application observability and performance. It incorporates the following elements:
Analyze:
- App dashboard: a quick assessment of your app’s health and performance.
- Live metrics: a real-time analytics dashboard for insight into application activity and performance.
- Transaction search: trace and diagnose transactions to identify issues and optimize performance.
- Failure view: identify and analyze your application’s failures to minimize downtime.
- Performance view: look at application performance metrics and potential bottlenecks.
Monitor:
- Alerts: monitor a wide range of aspects of your application and trigger various actions.
- Diagnostic settings: set up the continuous export of logs and metrics from the platform to your chosen destination.
- Logs: retrieve, consolidate and analyze all the data collected in Azure monitoring logs.
- Workbooks: create interactive reports and dashboards that visualize application monitoring data.
Use Case:
- Users, sessions and events: determine when, where and how users interact with your web application.
- Flows: View the user journeys on your site to identify high engagement areas and exit points.
Architecture of the solution

Application Insights collects data from several sources:
- Applications Dynamics 365
- Azure platform
- Infrastructure
- Custom sources specific to Dynamics
This data is ingested into Azure Monitor, then stored in a Log Analytics workspace
Application Insights allows you to interact with this data via:
- Configurable alerts
- Visualizations in Power BI or Azure Data Explorer
- Automation of actions via Logic App
Gather monitoring needs
To create a monitoring and telemetry solution, it is essential to define the appropriate requirements. This approach also ensures that the solution meets your team’s needs and provides actionable insights that help maintain the health of your applications.
Understanding the business objectives
Start by identifying the general objectives that your monitoring solution should support. These objectives should be aligned with your organization’s strategic priorities:
- Reduce downtime and improve system availability.
- Optimize performance to improve user experience.
- Gain visibility into key business processes.
Identify the main stakeholders
Capture the explanations of all stakeholders who will use or benefit from the monitoring solution:
- Equipes IT
- Development teams
- Support teams
- Direction
Examples of questions to ask stakeholders:
- What information is essential for your role?
- What problems or difficulties are you facing today?
- How do you plan to use telemetry data in your workflows?
Define use cases
Document specific scenarios requiring monitoring and telemetry. Use cases ensure that the solution meets the real needs:
- Monitoring of API call success and failure rates
- Alert on abnormal increases in response time
- P90 Tracking (the values at the 90th percentile), for purchase order processing
- Tracking customer interactions via a sales pipeline
- Measure resource consumption to optimize costs
Determine the metrics and KPIs
Define key performance indicators (KPIs) that provide information about the health and performance of your application:
- Performance measures: Response time.
- Error measures: Exception rate and number of failed transactions.
Establish alert and notification requirements
Identify the conditions under which alerts should be triggered and determine how notifications are managed:
- Define thresholds that balance sensitivity and relevance.
- Use severity levels to prioritize alerts.
- Define escalation paths for unresolved alerts.
Notification channels:
- Text (SMS)
- Microsoft Teams/Ticketing tool integrations.
Take into account data retention and confidentiality
Define the retention period of telemetry data and ensure compliance with data privacy regulations.
- Retention Periods: Tailor retention periods to operational and compliance needs. Consider costs and establish an archiving policy.
- Privacy considerations: Ensure personal information is excluded or anonymized as necessary.
Assess visualization needs
Determine how telemetry data should be viewed to provide actionable insights.
- Dashboards: Create role-specific dashboards.
- Reports: Define periodic reporting requirements.
- Custom queries: Use tools such as Azure Data Explorer to explore data interactively.
Aligning with organizational governance
Make sure your monitoring solution adheres to your organization’s governance policies:
- Access control to telemetry data
- Audit trails for changes to monitoring configurations
- Budgetary constraints and cost management
Document requirements carefully
Create a detailed requirements document that can guide the design and implementation of your monitoring solution.
- Objectives
- Contribution of stakeholders
- Use cases
- Performance indicators
- Alert policies
- Data retention policies
Use of monitoring during the project life cycle
Design phase
- Define key indicators and KPIs: collaborate with sales and technical teams to identify the most important indicators (e.g. transaction times, error rates, custom indicators such as order release times, work order processing times, etc.).
- Instrumentation planning: determine how telemetry hooks, custom events and logging will be integrated into your solution.
- Set alert thresholds: establish acceptable performance limits for each KPI, which will later become alert triggers.
Build
- Implement Telemetry and Logging: as developers create customizations, they can use the X++ APIs in D365 Finance to send telemetry data to Application Insights.
- Create automated tests with monitoring in mind: Integrate Application Insights telemetry into your integration and functional tests to validate the overall robustness of your solution. By analyzing the telemetry during testing, you can quickly detect issues such as performance bottlenecks, unexpected errors or data inconsistencies, and focus on the quality of the solution.
- Iterative reviews: Perform regular reviews of your App Insights telemetry to verify that you are collecting relevant metrics for all critical components. Adjust or add instruments as necessary to maintain complete visibility into system behavior. This continuous feedback loop allows you to refine your implementation and better cover the key aspects of your solution.
Pre Golive Phase
- Configuration to monitor availability and performance: in the Application Insights for production resource in the Azure portal and enable availability testing to monitor availability and performance.
- Configure alert rules and action groups: Set up alerts for main scenario processing times, page load times, number of exceptions, and transaction latency. Determine who should be notified and how. Validation in a sandbox environment: Test your monitoring configuration outside production. Verify that the shared telemetry is actually relevant to assess the status of the solution and provides proactive signals to prevent larger issues. Consider adopting or creating visualizations to identify trends and identify key information.
- Optimize log retention and sampling: adjust how much telemetry data you retain and if you apply sampling to reduce noise and manage costs.
Post Golive Phase
- Monitor real-world usage: keep an eye on live data to ensure the system meets performance SLAs and remains free of critical errors.
- Refine and evolve: Regularly review your monitoring strategy. Add or remove indicators, adjust alert thresholds and refine dashboards.
- Leverage advanced analytics: integrate with log analysis workspaces for deeper insights and correlation across multiple data sources.
- Proactive optimizations: use live performance data to identify patterns (such as peak usage hours or repeated errors) and proactively address them.

Leave a comment