
- Introduction
- Prerequisites
- Configure D365 Finance
- Type of telemetry
- How to use telemetry
- Analyze and monitor telemetry with KQL
Introduction
The monitoring and telemetry feature is a direct point-to-point integration between an instance of D365 Finance and the Azure Application Insights destination. Azure Application Insights is a service hosted on Azure that collects telemetry data for analysis and presentation purposes.
Prerequisites
Azure subscription
An active azure subscription and the right to create resources.
Application Insights resource in Azure
This resource will collect, analyze and view telemetry data from Dynamics 365
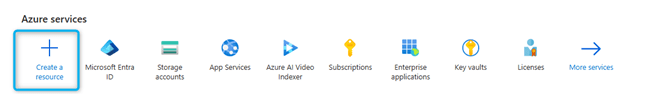
- Log in to the Azure portal.
- Select Create a resource.
- Open the Monitoring and Diagnostics category, then select Application Insights.
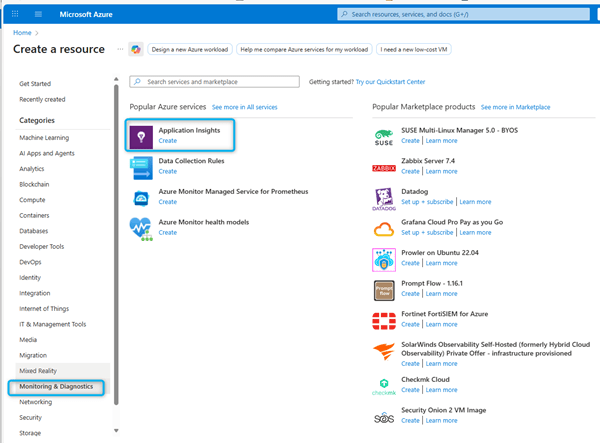
- Enter all relevant information, then review and create your Application Insights resource.

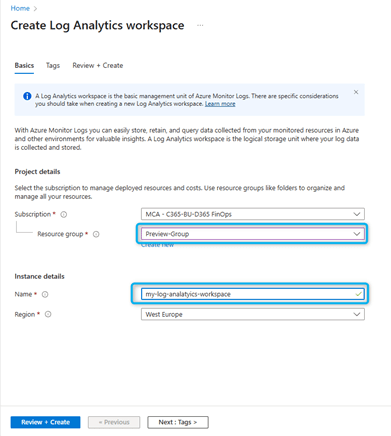
- If you do not have a defined Log Analytics Workspace, you must create one beforehand:
After creating your resource, you can find the corresponding workspace information in the Application Insights Overview pane.

It is important to note the instrumentation key and the connection string.
The connection string identifies the resource to which you want to associate your telemetry data. You can also use it to change the endpoints used by your resource as the destination of your telemetry data. You must copy the connection string and add it to your application code or an environment variable
Configure D365 Finance
Monitoring and telemetry function
- In D365 Finance, open the Feature Management workspace.
- Filter the feature list to find the Monitoring and Telemetry feature. Select it, then select “Activate”.

Note that from 10.0.44 this feature is enabled by default
Environments
Environments are classified according to one of the following modes: development, test or production.
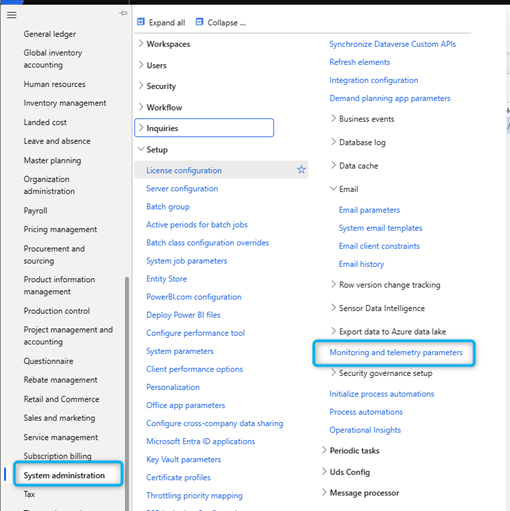
In Finance and Supply Chain Management, go to System Administration > Monitoring and Telemetry Parameters.
On the Monitoring Settings page, in the Environments tab, create a record for each environment for which you want to issue telemetry data. You can enter multiple environments here. By entering all your environments, you ensure that the database refresh operations include this configuration and are synchronized between them.
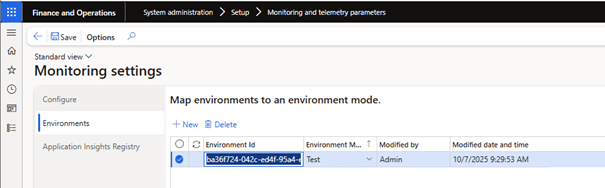
| Field name | Description |
| Environment ID | The unique environment identifier. |
| Environment mode | A value that specifies whether the environment is a development, test, or production environment. This field is used to separate the telemetry in different instances of Application Insight intended for development, testing or production. |
The information for the environment id is at the PPAC or LCS level:

Registre Application Insights
In the Application Insights Registry tab, create a record for each environment mode used
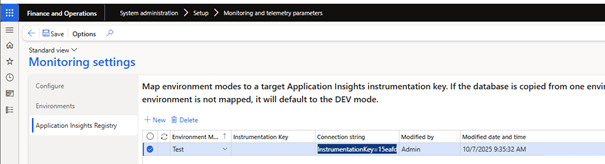
| Field name | Description |
| Environment mode | A value that specifies whether the environment is a development, test, or production environment. |
| Instrumentation key | The instrumentation key used to connect to Application Insights. if a connection string is specified, the instrumentation key is ignored. |
| Connection Tring | The connection string used to connect to Application Insights. |
Type of telemetry
In D365 Finance, go to System administration > Monitoring and Telemetry parameters.
On the Monitoring settings, in the Configure tab, enable the option for each type of telemetry to be issued.
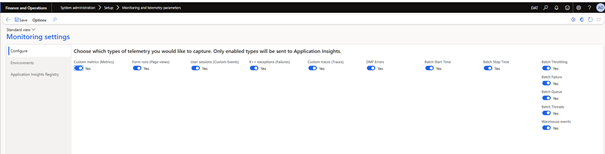
Metrics (custom Metrics)
Numerical values that represent system performance or activity.
The custom system or code generates counts, averages, or durations. Unlike page views or errors, metrics are not descriptive logs, but structured numbers.
Examples:
- Duration of a purchase order posting routine.
- Speed of data integrations (lines per second).
Indicators allow you to set benchmarks for your performance. For example, you can measure the time required to validate a customer order and detect any sudden slowdown.
Equivalent App Insights: customMetrics.
Forms Runs (page views)
Saves each time a user opens a form in FO.
When the form lifecycle starts, FO generates a telemetry event.
Examples:
- The user opens the All suppliers form.
- The user accesses the client invoice journal form.
Helps to identify the most frequently used forms.
Helps measure form performance: slow loading times can be attributed to SQL queries or customizations.
Equivalent App Insights: page views.
User sessions
Follows the moment when users log in, start a session and when their session ends. D365 Finance automatically generates events related to the user session lifecycle.
Examples:
- Session started for user Sébastien.
- Session ended after 30 minutes of inactivity.
Useful for activity audit (who logged in and when). Helps estimate number of active users and adoption.
In App Insights, these events look like custom events, but D365 Finance does not support trackEvent() free-form events as a custom Azure application. You only benefit from session tracking, not button clicks or arbitrary user actions.
Exceptions X++ (failures)
Captures errors and exceptions generated by X++ code.
Whenever the business logic fails unexpectedly, FO logs it.
Examples:
- Division by zero error in a custom calculation.
Identifies coding issues or customization bugs: recurring errors can indicate a risk in financial entries.
Equivalent App Insights: exceptions.
Custom traces (Traces)
Messages added by the developer for debugging or monitoring.
Developers call Trace::WriteLine(“message”) as X++ code. These messages then appear in the telemetry.
Examples:
- “Workflow approval has reached stage X.”
- “Batch task: 500 records processed successfully.”
Tracks business events that D365 Finance does not record by default. This solution can serve as a workaround to monitor clicks on buttons or process checkpoints (since D365 Finance does not capture clicks by default).
Equivalent App Insights: traces.
DMF Errors
Data Management Framework (DMF) errors, used for imports/exports.
The execution of DMF tasks is instrumented and failures generate telemetry.
Examples:
- The import failed because a mandatory column was missing.
- The export has expired due to the large file size.
Essential for monitoring integration pipelines. Helps teams react quickly in case of a night task failure.
Equivalent App Insights: stored as exceptions, reported in DMF context.
Warehouse events
Telemetry of warehouse operations, mainly mobile device workflows.
Warehouse mobile device activities generate structured telemetry.
Examples:
- The worker started a sampling list.
- The scanning of the barcode failed.
Provides visibility into the execution performance of the warehouse. Helps identify bottlenecks (e.g. scanning errors, slow execution).
Equivalent App Insights: displays as custom events or traces with warehouse metadata.
How to use telemetry
From App Insights itself, you can get interesting telemetry data.
First, you can run a query on the data to validate that you actually have data in App Insights. If you have form views enabled, open a few different forms in the D365 Finance app and you should see data here in the log when running a query.
If you are a developer familiar with the Kusto Query Language (KQL), you can connect to a cluster in Azure Data Explorer and run advanced queries to further analyze telemetry data.
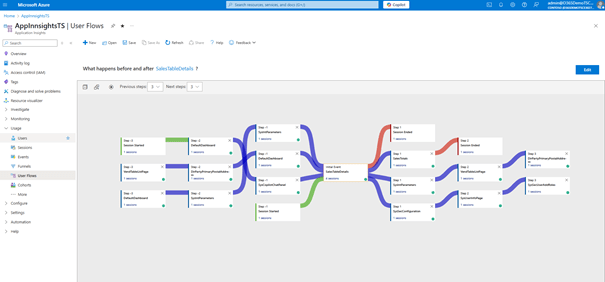
There are many other types of views. For example, you can view a user’s exact process and timeline.

You can look at the user flows and see how the user got into a specific form, where they came from and where they went next:
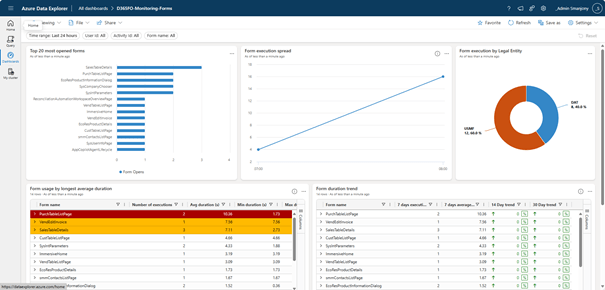
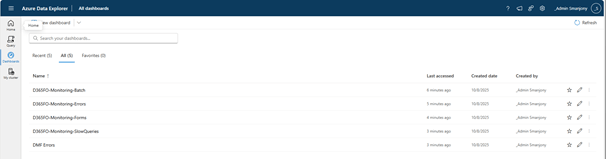
Another option is to use Azure Data Explorer to view telemetry data. Several FastTrack dashboards are available on GitHub as templates. This allows identifying trends presenting the most important usage or performance issues, and for example to identify areas to optimize at the interface or customizations level.
Besides using Application Insights, you can also use Power BI as a third option.

Best practices for effective monitoring:
- Define relevant KPIs: response time, error rate, request latency.
- Implement smart alerts: thresholds based on machine learning.
- Automate diagnostics: use KQL to generate detailed reports.
- Integration with ITSM: connect Application Insights with tools such as ServiceNow, FreshService, etc.
- Train the teams: ensure the development of skills in logarithmic and metric analysis.
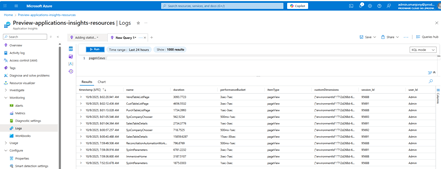
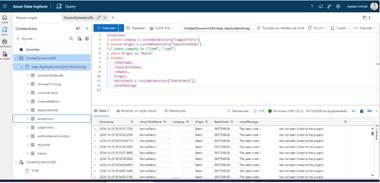
Analyze and monitor telemetry with KQL
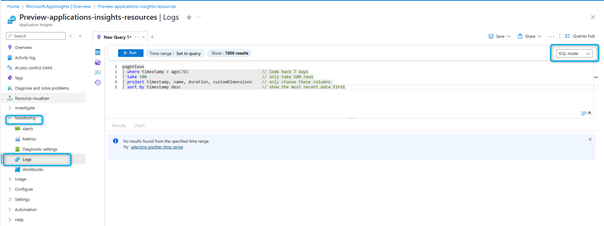
The telemetry of Microsoft Dynamics 365 Finance and Dynamics 365 Supply Chain Management is stored in Application Insights. To query this telemetry, the Kusto query language (KQL) is used
- In the Azure portal, open your Application Insights resource.
- In the Monitoring menu, select Logs.
- To obtain the last 100 traces, in the New request tab, enter the following query: Analyze and monitor telemetry withKQL – Finance & Operations | Dynamics 365 | Microsoft Learn.
Using workspace-based resources, Azure Application Insights sends telemetry to a common Azure Log Analytics workspace. This gives you full access to all the features of Azure Log Analytics, as well as your application, infrastructure and platform logs from a single consolidated location. This integration enables role-based Azure access control for all your resources and eliminates the need for cross-application/workspace queries.
The following table displays the names of the tables for D365 Finance Telemetry when queried from Azure Application Insights and Azure Log Analytics.
| Table name | Table name in Azure Log Analytics |
| traces | AppTraces |
| pageViews | AppPageViews |
| exceptions | AppExceptions |
| customEvents | AppEvents |
| customMetrics | AppMetrics |
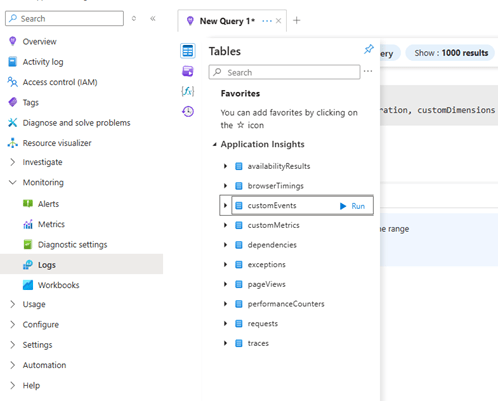
You can use Kusto queries as a data source in many places:
- The Application Insights logs part in the Azure portal
- Power BI reports
- Alerts
- Azure dashboards
Examples
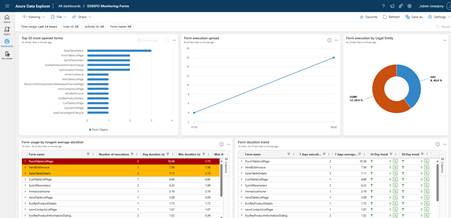
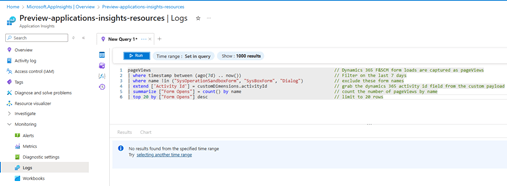
List of the 20 most used forms: The loading times for Finance and Supply Chain forms are recorded in pageViews. You can use this information to query form loads. You will be able to know the most used forms, the slowest and other information: Analyze and monitor telemetry withKQL – Finance & Operations | Dynamics 365 | Microsoft Learn.
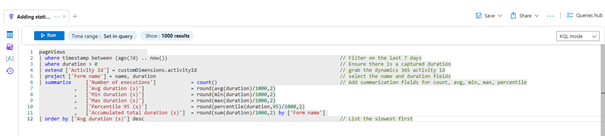
Adding statistics about the duration of forms: retrieving the slowest forms: Analyze and monitor telemetry withKQL – Finance & Operations | Dynamics 365 | Microsoft Learn
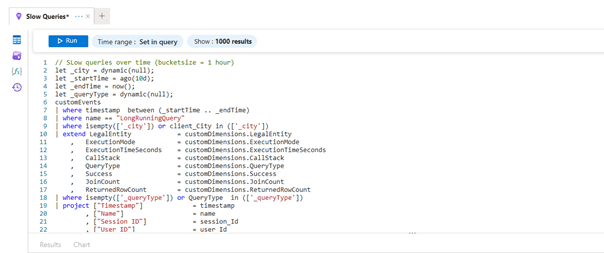
Slow Query :
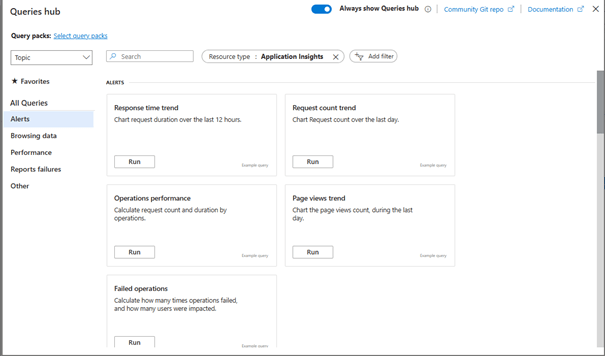
Request Hub
The query hub allows us to execute several pre-configured queries based on query typologies:
- Alerts (duration and number of executed requests, response times…)
- Browsing data (number of page views, slow forms)
- Performance (duration and number of executed queries, response times…)
- Error reports (slow pages, operations in errors, exceptions that caused errors)

Leave a comment