- Introduction
- What Is the Telemetry Batch Agent?
- Architecture
- Prerequisites
- Install & Configure
- Suggested Prompts
- Business advantages
Introduction
Organizations running D365 F&SCM often want more detailed and automated visibility into batch workloads. Common pain points include difficulty in tracking execution times, limited error observability, difficulty monitoring thread availability, and poor visibility into throttling.
This agent can help you detect exceptions and trace call stack, identify execution patterns, pinpoint performance bottlenecks, recommend optimizations, monitor thread availability, analyze throttling, and handle multi-environment telemetry.
Batch jobs are the backbone of every Dynamics 365 Finance & Supply Chain Management implementation. They post journals, calculate costs, run MRP, settle inventory, and keep the financial engine running — often outside business hours, often unattended.
Batch management remains one of the most painful operational areas:
- Failures are discovered too late
- Performance issues are diagnosed reactively
- Root-cause analysis requires deep technical skills
- Telemetry exists, but is underutilized
This article introduces the Telemetry Batch Agent release by FastTrack team (thanks to them), an AI-powered monitoring and diagnostics solution for D365 Finance. Built with Copilot Studio and Application Insights, it transforms raw telemetry into actionable insights — using natural language.
What Is the Telemetry Batch Agent?
The Batch Telemetry Agent is an AI-powered monitoring and diagnostic Copilot Studio agent for Dynamics 365 Finance & Supply Chain Management focused on batch job framework observability. It integrates Azure Application Insights telemetry with Copilot Studio to deliver actionable insights, root-cause analysis, and optional auto-remediation guidance.
The Batch Telemetry Agent is an AI-driven observability agent for D365 Finance batch jobs. It connects Application Insights telemetry with Copilot Studio, allowing users to:
- Ask natural-language questions about batch execution
- Detect anomalies such as throttling, long runtimes, or failures
- Analyze trends in priorities, threads, and queues
- Receive guided explanations and remediation suggestions
Instead of manually querying logs or building KQL expertise across teams, the agent acts as an intelligent interpreter of batch telemetry.
At its core, the agent:
- Reads batch telemetry emitted by D365FO
- Queries Application Insights using KQL
- Interpret results using large language models
- Presents insights through Teams, M365 Chat, or Copilot Studio
Architecture
- Built on Copilot Studio with connectors for Run Analytics and Visualize Analytics.
- Uses KQL queries to fetch telemetry from Application Insights.
- Sources: D365 Finance Batch Framework logs + custom events.
- Ingestion: Azure Application Insights.
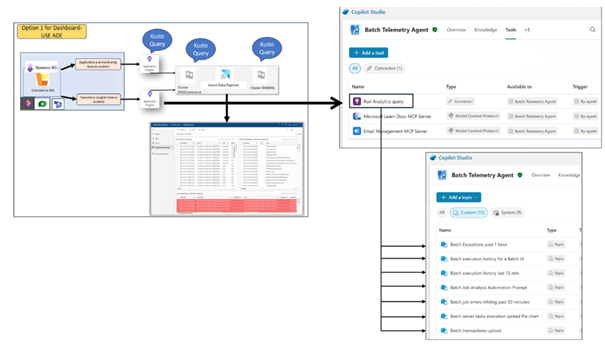
Flow
- D365 Finance emits batch execution telemetry
- Telemetry is stored in Application Insights
- The Telemetry Batch Agent queries App Insights using KQL
- Users interact via Teams, M365 Chat, or Copilot Studio
- Optional remediation or automation can be triggered
Key Components
- Application Insights – telemetry store
- Copilot Studio Agent – conversational interface and orchestration
- KQL Query Tool – structured data access
- Power Automate (optional) – automation and self-healing actions
By design, the agent is read-only by default, ensuring safe adoption in production environments.
Key capabilities
Enables non-developers, but key business, support and IT stakeholders to query batch telemetry via Microsoft copilot studio chat, Teams, M365 Copilot chat and turns complex diagnostics into actionable guidance. Business stakeholders along with admin and support teams to remain proactively aware of the batch framework, rapidly identify and resolve bottlenecks, and fine‑tune job timings—reducing delays and meeting deadlines, while the agent translates technical data into business‑focused recommendations.
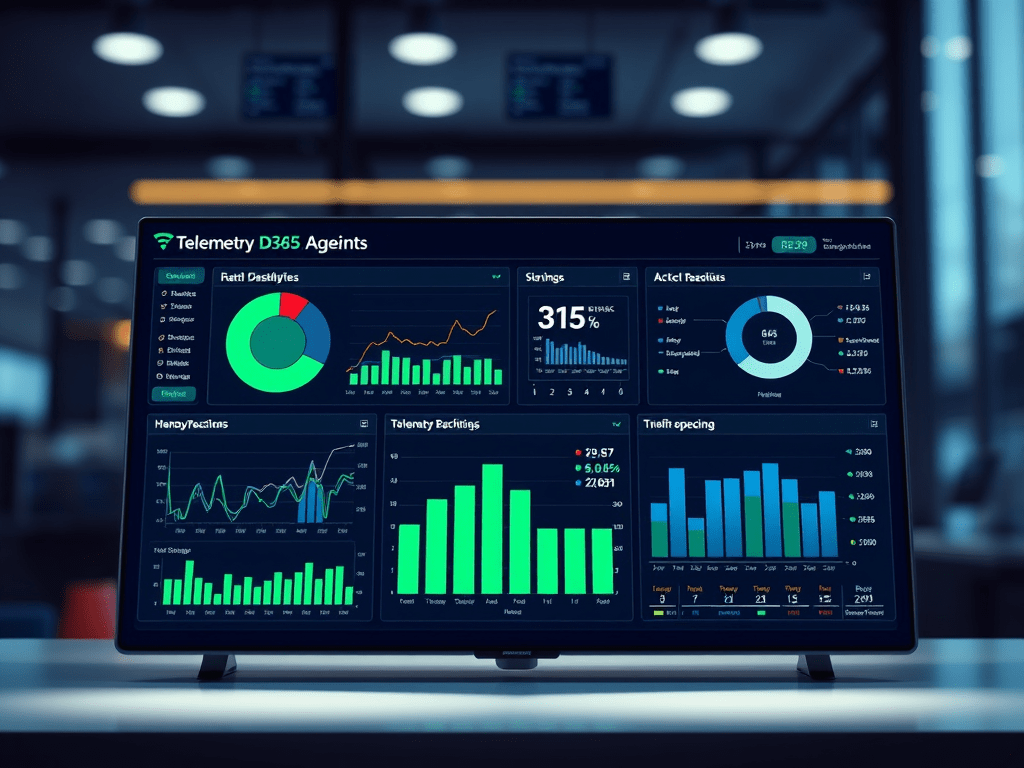
- Intelligent observability: Delivers a unified view of batch job telemetry (jobs, threads, throttling, errors) with environment-aware filtering and timeseries visualization.
- Anomaly detection & optimization: Can deliver alerts for spikes and unusual patterns, recommending adjustments for scheduling (if paired up with Dynamics 365 ERP MCP server), concurrency, and throttling.
- GPT-assisted root cause analysis reports: Generates Batch framework analysis reports which are sent over email and team’s channel.
- Exception detection & tracing: Identifies Infolog errors within specific ranges, highlights top failing jobs, and connects to code-level trace details.
- Thread availability monitoring: Displays real-time and trending data on available threads, helping to locate clusters of contention.
- Throttling analysis & alerts: Detects throttling incidents, correlates them with CPU, memory, or SQL DTU usage, and triggers threshold-based alerts.
- Execution history & comparisons: Accesses job run histories, calculates averages, and provides visual comparisons between two jobs.
- Multi-environment support: Recognizes shared Application Insights, prompts for environment ID and time, and applies intelligent filters automatically.
- Action-oriented monitoring: Summarizes findings with recommended next steps, if enabled, can integrate with incident workflow tools such as Azure Dev Ops, confluence etc.
Prerequisites
Before installing the Telemetry Batch Agent, ensure the following:
- D365 Finance & Supply Chain version 10.0.45 (PU69) or later
- Application Insights enabled and connected to D365 Finance. Dynamics 365 Finance & Supply Chain Management includes a Monitoring and Telemetry capability that sends application telemetry to Azure Application Insights. The Batch Telemetry Agent requires your environment to be configured to capture batch framework telemetry in Azure Application Insights
- Access to: Copilot Studio, Power Automate and Outlook (Outlook is used to send email updated after the analysis.), Microsoft Teams
- App Insights API Access (Application ID + API Key) for query tool
Install & Configure
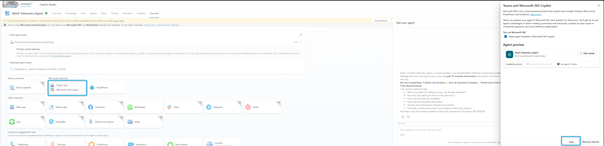
Import Solution
- Download the zip file in: Dynamics-365-FastTrack-Implementation-Assets/Agents/AI ERP Agents/Batch-Framework-Telemetry-Agent/Solutions at master · microsoft/Dynamics-365-FastTrack-Implementation-Assets · GitHub
- Import the solution: Go to make.powerapps.com → Solutions → Import
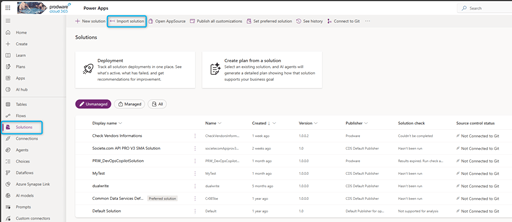
or directly clicking on Import Agent from Copilot studio.
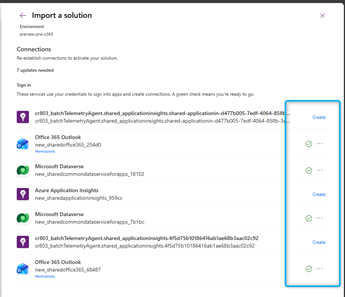
- The wizard prompts to create/sign in to required connections.
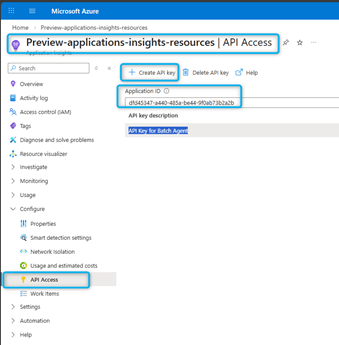
This is where we need our App ID and API Key:
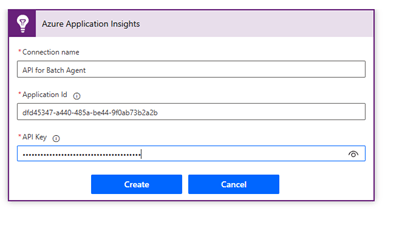
You need to go into the resource related to Apps Insight and create a Key API:
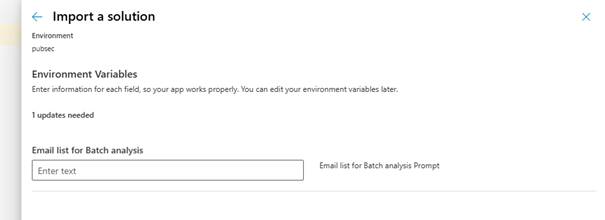
4. After this you will be prompted to add email list. Provide a valid email id where you would like to receive Batch Execution analysis emails from the agent.
5. Click **Import** and wait for completion.
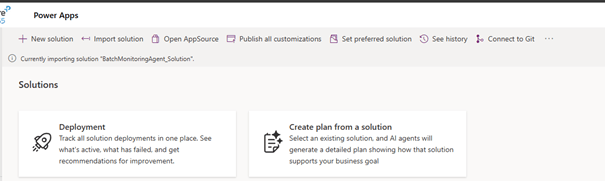
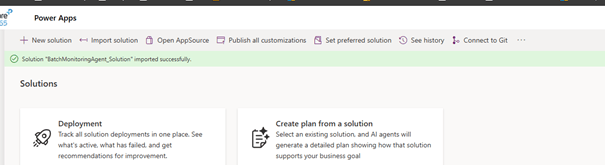
6. On success, you’ll see confirmation:
7. Open the solution and verify components and environment variables
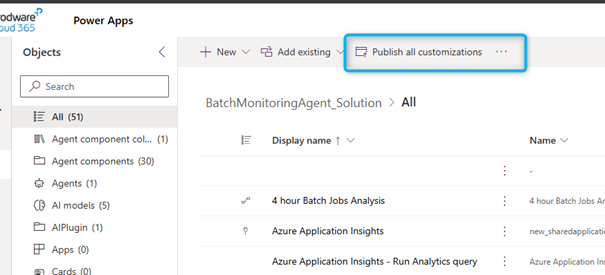
8. Then publish all customizations as indicated in the above image.
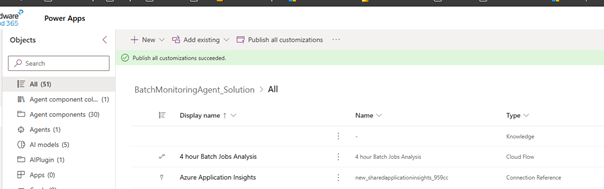
This ensures the agent, flows, and connections are fully activated.
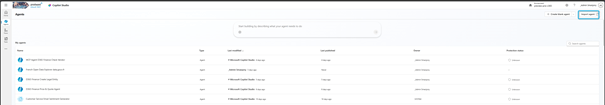
Verify Agent & Connections
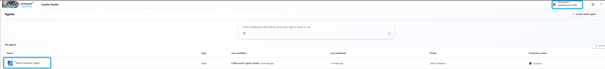
- Open copilot studio and select the correct environment.
You should see “Batch Telemetry Agent.”
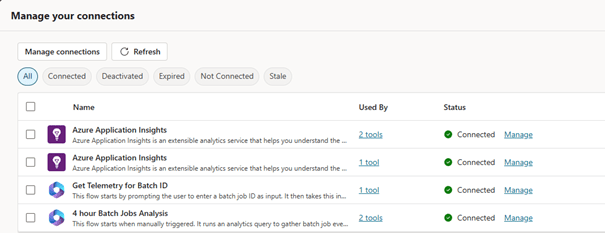
- In the test pane, choose Manage connections to confirm everything is properly linked.
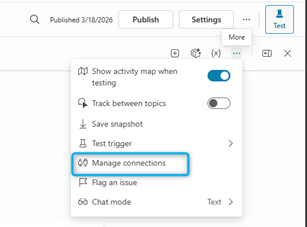
- Ensure all are Connected; create missing ones if needed.
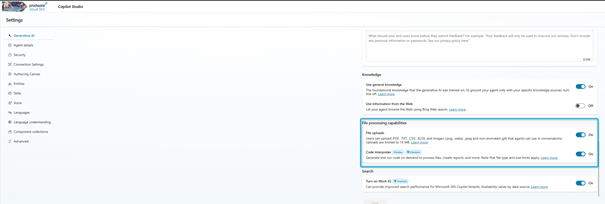
Enable Code Interpreter and File processing
Go to settings and enable the File processing and code interpreter features. The File upload feature enables you to upload data and gain insights, and the code interpreter feature helps in generating code on the fly to visualize and analyze the data returned in your chats.
These features allow:
- Uploading telemetry data
- Generating visualizations
- On-the-fly analysis of query results
Enable Channels
Go to Channels and enable Teams and Microsoft 365 channels.
Republish After Changes
If you modify any of the following, republish the agent (Do this any time you modify the agent):
- Topics
- Instructions
- Switch model to Chat GPT-5
- Add triggers
- Add MCP tools or connectors
Suggested Prompts
- “Show me last 1 hour Priority distribution.”
- “Were any of my batch jobs throttled recently?”
- “How many threads are currently available for batch jobs?”
- “Provide details about recent batch job failures.”
- “Show CPU, Memory, and SQL DTU metrics during batch throttling events.”
- “Batch Execution History for Batch Job Id ”
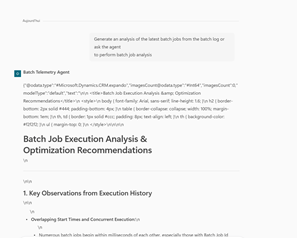
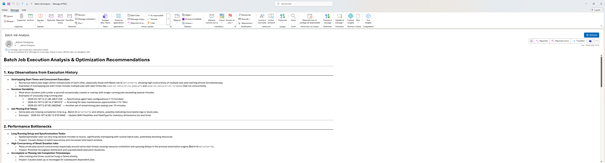
- Generate an analysis of the latest batch jobs from the batch log or ask the agent
to perform batch job analysis
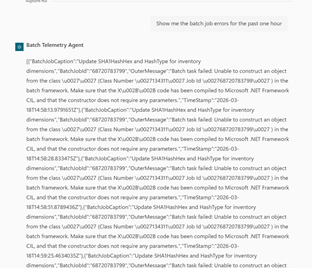
- “Show me the batch job errors for the past one hour”
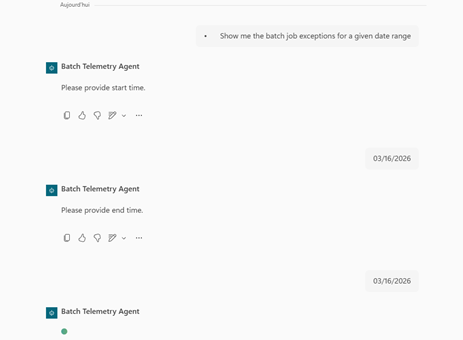
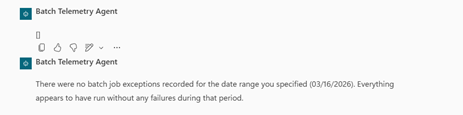
- Show me the batch job exceptions for a given date range
Business advantages
1. Reduction of operational interruptions
- Immediate detection of batches in error or time overrun.
- Prevention of delays impacting critical processes: billing, MRP, integrations, accounting validation.
- Less reliance on IT teams to diagnose and react to improved business continuity.
2. Resolution time acceleration (MTTR)
- The agent automatically identifies the probable cause, the error, and the impacted batch.
- No more need to search LCS, D365 or App Insights: the agent provides the summary directly.
- Reduction of time spent by support, functional and technical teams.
3. Real-time transverse visibility
- The professions obtain a clear view of the status of the treatments (MRP, journalization, integrations…).
- CIOs have a consolidated view of the health of operations.
- Faster decisions because contextualized information.
4. Improvement of the system performance
- Automatic analysis of the longest, most expensive, most unstable batches.
- Recommendations for optimizing planning, priorities, night windows.
- Better use of cloud resources potential cost reduction.
5. Proactive support & fewer tickets
- Early alerts on batches that degrade their performance over time.
- Prevention rather than reaction
- Fewer delayed accounting closures
- Less disruption in integration flows
- Fewer incidents escalated in project teams
6. Autonomy of the business teams
Non-technical users can query the agent:
- “Why is the MRP late?”
- “Which batches failed today?”
- “Which batch consumes the most resources?”
No more waiting for support to get insights.
7. Acceleration of projects & test cycles
- During UAT or deployments, the agent highlights:
- the modified batches,the impacts on performance,
- the new mistakes.
- Reduces validation times and secures go-live.
8. Governance & performance management
- Automatic reports for IT or CoDir committees.
- Relevant indicators:
- failure rate,
- critical batchs,
- performance trends,
- comparison by environment (Tier-2 vs Prod).
- Improves the operational maturity of the organization.

Leave a comment