
Overview of telemetry
Telemetry information in the Dynamics 365 implementation portal is available as a public preview. The features in the preview version are not intended for use in production and may have limited functionality.
Telemetry information detects optimization opportunities and provides practical guidance based on usage patterns in customer environments. Results appear with severity indicators when they require special attention.
You can activate the telemetry information yourself with the telemetry configuration guide.
Configure the telemetry
Enable telemetry by selecting the New Telemetry Request action on the Active Telemetry Requests page.
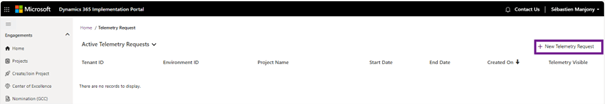
The Active Telemetry Requests page displays the environments in which the telemetry recommendations are currently visible or awaiting approval. It also displays their associated tenant ID, project ID (if applicable) and respective start and end dates.
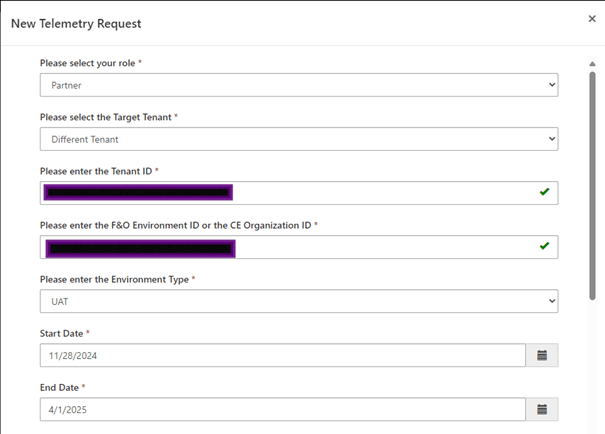
The first step in the Setup Telemetry Guide is to submit basic environment details.
Specify your role:
- Partner: Choose this option if you are a partner and you want to view telemetry for your customer’s environment.
- Customer: Choose this option if you are a customer of Microsoft and you want to view telemetry for your environment.
Specify the type and ID of the Microsoft Entra tenant for whom this request is intended:
- My Tenant: Select this option if you are switching on telemetry for an environment on your tenant. The Tenant ID is displayed in the Your Tenant ID field.
- Different Tenant: Select this option if you are switching on telemetry for a different tenant than the one you are currently signed into.
For projects with finance and operations applications, you can find the tenant ID in Dynamics 365 Lifecycle Services. You can also get this information from the Azure portal. Make sure you are logged in to the tenant for whom you want to retrieve the ID.
Specify environment and date information, including an environment ID: Look for the environment and organization credentials in the Power Platform admin center or in Lifecycle Services.
Specify the purpose of the environment:
- Production: An environment used for live business operations.
- UAT: An environment used for standard acceptance testing.
- Sandbox: An environment used for preproduction testing.
- Performance: An environment used for performance testing.
- Dev: An environment used for development.
Specify the start date and end date of the period during which you want the telemetry information to be visible. Allow a minimum of 7 days or more to receive daily updates during the specified period.
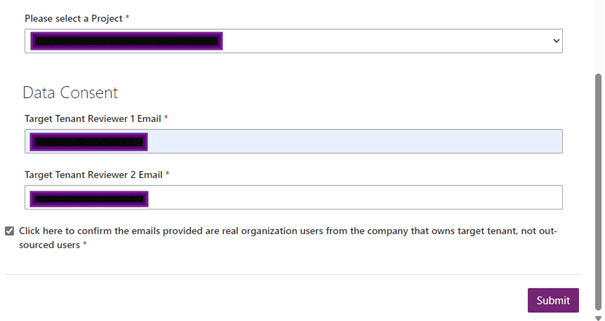
If the specified tenant is associated with an existing Dynamics 365 implementation portal project, you are prompted to associate this request with the appropriate existing project from a drop-down list. You do not need a project to configure telemetry information for production environments.
You must have a project to enable telemetry information for all non-production environments. If no project exists, create one with the integration wizard.
Consent for data sharing
If you have selected Different Tenant as the role. As part of the data privacy principles, Microsoft requires the consent of two target tenant user contacts who are part of the environment tenant.
There are two fields for this section, and each accepts an email address in the format name@company.com.
- Target Tenant Reviewer 1 Email
- Target Tenant Reviewer 2 Email
After providing the email addresses, select the Click here to confirm that the emails provided are real users of the target tenant’s corporate owner organization, not outsourced users, then choose the Submit action.
An email is sent to both reviewers of the target tenant to approve the user’s access as well as the link and other details. Although the telemetry request is created, the telemetry will not be resolved until the client tenant’s reviewers have approved access. You can cancel the request and edit the approvers’ emails from the Telemetry Information and Data Consent options page once the request is created.
Analyze with Telemetry insights
Telemetry insights detect optimization opportunities and provide actionable guidance based on usage patterns in environments. Results surface with severity indicators as they require attention.
Some of the most popular performance-related rules. They are designed to enhance your environment’s efficiency:
- Identify Percentage of Slow Network Users: This rule evaluates the overall percentage of users experiencing slow network performance.
- Identification of Network Latency and Throughput by Country: This rule identifies the count of users and their associated bandwidth and latency for network connections.
- Evaluate Sync Call Impact: This rule detects the impact of sync calls on all form loads.
- Identify the source of OnLoad Sync calls: This rule identifies the origins of synchronous calls triggered by form onload scripts.
- Evaluate Timeouts from Async Ribbon Rule Evaluations: This rule identifies all method names where the Ribbon Rule Evaluation code fails to resolve or results in a timeout.
- Identify the source of Role calls: This rule identifies the origin of synchronous calls made specifically to retrieve the assigned roles for a user.
- Identify Save Form call on Loading of Form: This rule identifies and quantifies form loads affected by the unnecessary triggering of a Save operation during the form load process.
Telemetry insights offer customers and partners the ability to view customized results based on their environment usage patterns.

Users of telemetry insights will be provided with a meaningful signal of potential Improvement areas along with prescriptive guidance on how to take action to optimize their Dynamics 365 environments.
Patterns emerge as the last seven executions and corresponding results are surface free each rule.
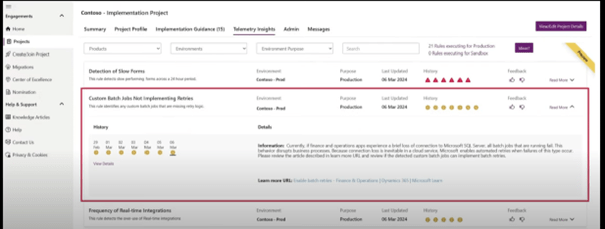
By selecting read more on the specific results a user will be shown actionable guidance in the form of documentation best practice information or Tech Talks
By selecting view details additional results and information is provided to pinpoint specific areas of Interest related to the findings
Feedback can be provided by using the ideas button or on the specific results by utilizing the thumbs up or thumbs down icons.
Telemetry recommendations
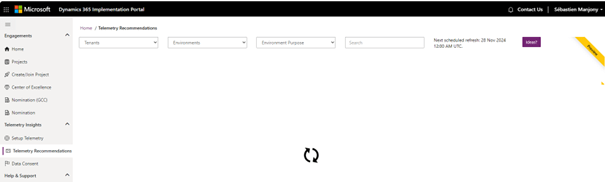
The Telemetry Recommendations page displays various results for all environments that have been configured and approved for telemetry information.
Once the telemetry setup is complete, results begin to display, depending on the purpose of the environment. The recommendations for production environments are displayed approximately 15 minutes later. Recommendations for non-production environments begin to appear approximately 24 hours after the configuration is complete.
Results are grouped by results and environment.
Last updated Displays the last time an optimization opportunity was detected for the specified environment and returned a usable result.
History Provides a view of the last seven actionable results generated for the environment with visual severity indicators.
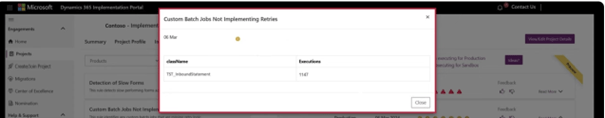
Learn more Expands the result to display practical tips based on the associated result. Additional details are provided with selectable history dates that will adjust the guidance based on specific results for that date. Selecting a date and selecting Show details opens a new view that provides additional technical details that vary with each result.
Select the Ideas button to provide feedback on telemetry information. You can also give feedback on specific results by selecting the “like” or “like” buttons.
You can apply filters to refine results by tenant, environment, and objective. The search can locate the names and descriptions of the results.
Use Copilot
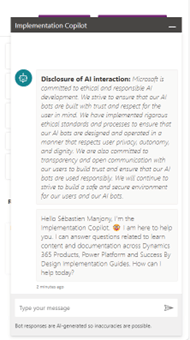
Copilot in the Dynamics 365 implementation portal helps you find documentation and advice for your Dynamics 365 and Power Platform implementation projects.
How to use Copilot
To launch Copilot, look for the icon in the bottom right corner of any page on the Dynamics 365 Implementation Portal.

What you can ask the copilot
Copilot in the implementation portal helps you find documentation and advice on MS products. It covers all product documentation for Dynamics 365 and Power Platform, as well as Success by Design and other implementation advice content.

Leave a comment