
- Introduction
- Understanding the costs of telemetry
- Telemetry cost control strategies
- View Azure Monitor usage and fees
- Best practices
- Conclusion
Introduction
Telemetry plays an essential role in managing and optimizing Dynamics 365 Finance & Operations Microsoft collects system events, user activities and performance data, then sends it to Azure Monitor (Log Analytics) so that administrators and auditors can derive insights.
For many organizations, telemetry is not only a technical tool but also a compliance requirement and a cost factor. SOX auditors rely on telemetry to confirm systems’ integrity. IT teams use it to resolve performance issues and executives rely on it to measure adoption.
Although telemetry is powerful, it is important to understand that it is not free. Azure Monitor charges for the storage and analysis of this data, and without proper planning, costs can escalate rapidly.
When you enable telemetry broadcast in Dynamics 365 Finance & Operations, the system sends diagnostic data to Azure Application Insights. This data allows administrators, developers, and auditors to analyze performance, troubleshoot issues, and even measure user adoption.
However, the telemetry sent by FO is not unlimited: it is predefined in several categories that you can enable or disable in system settings. Each category corresponds to a type of activity or event within the system.
Telemetry cost management in D365 Finance is crucial, as data sent to Azure Application Insights incurs fees from many factors. Implementing effective strategies allows you to control these expenses and ensure rigorous monitoring.
Understanding the costs of telemetry
Azure Application Insights is an extension of Azure Monitor. The main factors are data ingestion and retention. Azure Application Insights provides the necessary tools to get information about current usage. It also allows to automate the retrieval of information on usage costs, as well as to define thresholds and alerts in case of exceedance.
Azure Monitor uses a consumption-based billing (pay-as-you-go) model where you only pay for what you use. Azure Monitor features enabled by default are free. This includes the collection and alerts on the activity log, as well as the collection and analysis of platform metrics.
Several other features have no direct cost, but you pay for the ingestion and retention of collected data.
The Azure Monitor pricing page lists all monitoring features, but only a few are directly relevant to D365FO.
Ingestion of logs
D365 Finance telemetry data (errors, traces, diagnostics, performance counters) flows in an Azure Log Analytics workspace.
Pricing operation: you are billed per ingested GB. This is the highest cost, especially if you collect detailed telemetry data on production, UAT and development environments.
Every user action, performance event or error written in the telemetry is charged as an ingestion
- Execution of forms: opening of forms such as All suppliers or Customer invoice journal.
- System events: SQL wait times, service call performance, batch durations.
- User actions: button clicks, navigation, error messages.
Conservation of Logs
By default, the telemetry is stored in Log Analytics for a limited free period (usually 30-90 days depending on the type of journal).
How the rates work: Short-term storage is included at no extra charge. If you need to keep logs for compliance reasons (e.g. SOX requires longer audit trails), you pay a monthly fee per Go beyond the free retention period.
Fees apply when telemetry retention is greater than the free retention period:
- Retention of page view history for adoption analysis.
- Retention of batch task logs for SOX audits.
- Storage of error traces for a financial year as part of the audit evidence.
Queries and dashboards
Queries on certain tables are charged per GB of analyzed data. All queries in Log Analytics are written in KQL (Kusto Query Language).
D365 Finance telemetry data in Log Analytics is queried using the Kusto query language (KQL). KQL is the standard way to search, filter and view telemetry in Azure Monitor dashboards.
How Pricing Works: According to the Microsoft pricing model, query fees are calculated based on the volume of data analyzed. Larger queries or longer periods imply more data analyzed, and therefore higher costs.
The costs depend on the amount of data analyzed during the analysis:
- Querying the most consulted forms over the last 90 days.
- Filtering of batch tasks that have failed on multiple legal entities.
- Examination of SQL performance traces for optimization.
Alerts
Alerts help you detect problems in real-time, such as if a batch job fails, a performance counter exceeds a threshold, or a vendor bank account is created.
How the pricing works: you are charged for the execution of the alert rule, the data processed and sometimes the notification channel.
Email notifications are free, but SMS, voice calls, or webhook integrations may incur additional fees.
Fees apply for rules and certain types of notifications:
- Metric alert: DTU SQL usage > 80%.
- Log alert: > 10 errors in a 5-minute window.
- User activity alert: peak usage of the Vendor bank accounts form.
Data export
Some organizations export telemetry data from D365 Finance to other systems for compliance, integration or long-term archiving purposes.
Pricing operation: Continued export to Azure Storage, Event Hub or third-party tools incur data transfer fees. These fees are optional, you only pay if you set up exports.
Fees apply if data is exported out of Log Analytics:
- Export all telemetry data to Azure Storage for 7-year SOX compliance.
- Transmission of page view data to the company’s BI teams.
Average Monthly Rates and Costs
Telemetry pricing for D365FO is based on Azure Monitor Log Analytics pricing:
- Ingestion of newspapers: about €2.30 per GB ingested
- Data retention: first 31 days free; about €0.10 per GB per month beyond
- Queries: approximately €0.002 per GB of data analyzed
- Alerts: around €0.10 per metric alert rule per month, journal alerts depend on frequency and complexity
D365 Finance environment example (per month)
Hypotheses:
- 50 GB of ingested telemetry (production + sandbox)
- 90-day retention (60 days beyond free)
- Moderate requests (20 requests/day, analyzing 1 GB each)
- 10 active alerts
Estimated monthly cost
- Ingestion of logs: 50 GB * 2,30 = € 115
- Storage: 50 GB * 2 months *0.10 = € 10
- Requests: 20 * 30 * 1 GB * 0.002 = € 1.20
- Alerts: 10 * 0.10 = € 1.00
Total: ~ €127 per month
Telemetry cost control strategies
You can use the following strategies to control telemetry costs.
Selective collection of telemetry
- Production environment first: set up Application Insights to collect only essential telemetry data in production environments. This approach reduces data volume and associated costs.
- Management of custom telemetry: Be vigilant when adding custom telemetry. Make sure that all other data collected brings significant enough value to justify the cost.
Data retention policies
- Archiving Practices: Regularly archive telemetry data over 30 days in more cost-effective storage solutions. This approach allows you to control your storage costs and maintain access to historical data.
- Retention Configuration: Adjust the data retention settings in Application Insights to fit your organization’s compliance and analytics requirements. This approach allows us to optimize storage expenses.
Sampling
Sampling reduces telemetry traffic, data and storage costs, while preserving a statistically correct analysis of application data.
- Implementing sampling: Use sampling to collect a representative subset of telemetry data. This approach reduces the volumes and costs of data ingestion without significantly compromising information quality.
- Adaptive sampling: Use the adaptive sampling features to automatically adjust the sample rate based on traffic trends. This approach ensures efficient data collection.
Monitoring and alerts
- Cost Monitoring: Use Microsoft Cost Management tools to monitor Application Insights usage and set up alerts for unusual spending patterns.
- Daily limits: To avoid unexpected cost overruns, consider setting daily data ingestion limits. Be vigilant, as data loss could occur if this limit is reached.
View Azure Monitor usage and fees
To start analyzing your Azure Monitor charges, open Cost Management + Billing in the Azure portal. This tool includes several integrated dashboards for in-depth cost analysis, such as cost per resource and invoice details. Select Cost management, then Cost analysis. Select your subscription.
Then create a “Daily Costs” view and change the “Group by” setting to show costs per meter to view the costs of each feature
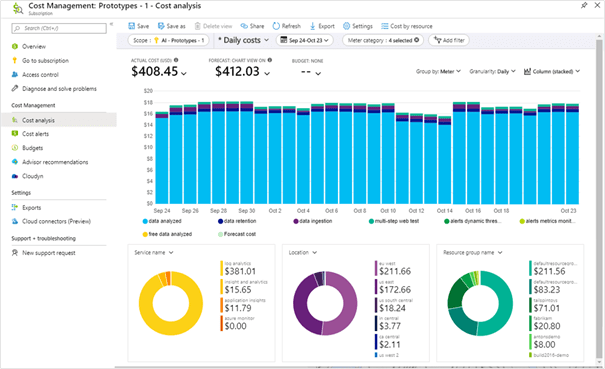
To limit the view to Azure Monitor fees, create a filter for the following service names:
- Azure Monitor
- Log Analytics
- Insight and Analytics
- Information on applications
The use of a Log Analytics workspace can be charged to one of the first three services (Azure Monitor, Log Analytics or Insight and Analytics), depending on the functionality.
Rather than manually analyzing your costs in the Azure portal, you can automate the delivery of information using the following methods:
- Daily cost analysis emails. After setting up your Cost Analysis view, select “Subscribe” at the top of the screen to receive regular email updates.
- Budget alerts. To be notified in case of a significant increase in your expenses, create budget alerts for a workspace or group of workspaces.
Best practices
- Workspace-based resources: make sure your Application Insights resources are workspace-based, so you can take advantage of cost-effective features such as basic logs and engagement levels.
- Data ingestion management: Configure the data collection to avoid unnecessary ingestion. Regularly check and adjust the types and volumes of data collected to adapt them to your monitoring needs.
- Conservation and archiving configuration: Define retention periods adapted to different types of data. Use archiving for long-term storage and control your costs.
Conclusion
When you enable telemetry broadcast in Dynamics 365 Finance & Operations, the diagnostic data is transmitted to Azure Application Insights, giving administrators, developers, and auditors the visibility they need to analyze performance, solve problems and measure user adoption.
However, it is important to understand that the telemetry in D365 Finance is neither unlimited nor arbitrary. It is structured into predefined categories, which can be activated or deactivated via the system settings. Each category corresponds to a specific type of activity in the system:
- Metrics capture structured performance values, such as the number of processes or publication durations.
- Form runs (page views) show user opened forms and their performance.
- User sessions provide a record of logins and activity periods.
- X++ exceptions highlight execution errors in business logic.
- Custom traces allow developers to integrate diagnostic checkpoints into processes.
- DMF errors expose issues in data imports/exports.
- Warehouse events track operational activity in mobile workflows.
From a pricing point of view, all these categories are grouped under the categories Log ingestion, Retention, Requests and Alerts in Azure Monitor. For example, form execution is charged as a PageView event, an exception as a Failed event, and a custom trace as a Trace event, all of which are accounted for in Azure Monitor’s Log Analytics pricing.
For customers, this means that telemetry pricing is not limited to log in general, but allows understanding of the categories enabled, the amount of data generated by each and the chosen retention period. A highly compliance-driven environment may require keeping session and exception logs for long periods of time, while a performance-driven environment may prioritize metrics and traces for optimization purposes.
By carefully choosing categories of telemetry, controlling retention and optimizing queries, you can achieve the right balance: enough visibility to meet audit and performance needs, without unnecessary ingestion and storage costs.

Leave a comment