
Introduction
D365 Finance integrates robust telemetry features that are ready to use when Application Insights is enabled. These features provide essential information on various aspects of the system and help customers monitor performance, diagnose problems, and optimize their operations. Microsoft provide some examples of Telemetry : https://github.com/microsoft/Dynamics-365-FastTrack-FSCM-Telemetry-Samples/tree/main/Dashboards/AzureDataExplorer.
Form Run Telemetry
Form run telemetry collects detailed information on the application forms. It provides information on the following points:
- Open forms
- Users who have accessed the forms
- Form loading times
These data allow:
- Analyze average loading times, P90 values and other performance measures to improve user experience.
- Identify frequently consulted forms and the possibility of optimizing them for better usability.
- Detect user behavior patterns to improve form design and navigation.
- Monitor form usage trends to effectively prioritize resources and updates.
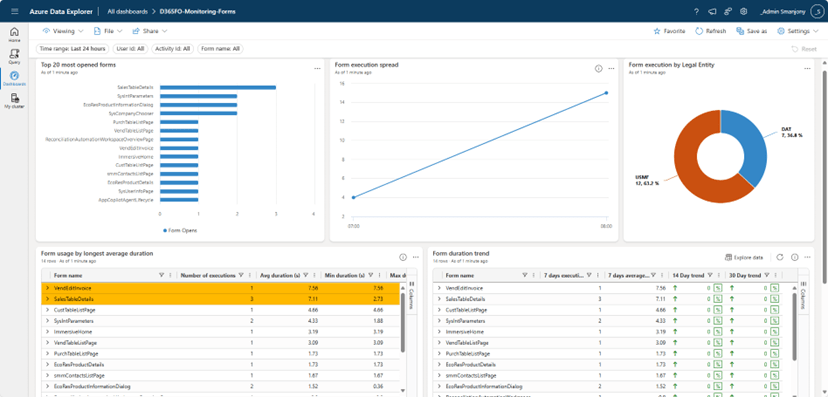
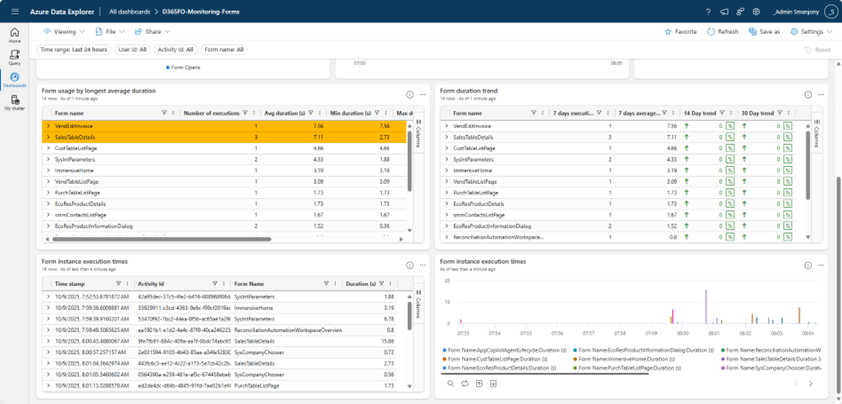
This dashboard presents information on the use of forms in Dynamics 365 Finance and SCM. It allows:
- Search for the most used forms in the environment with the possibility to filter on a specific user, form name or activity ID.
- Check the opening hours of the forms and find out which forms are the slowest.
- View current form loading time trends over the last 14/30 days.
- Check individual opening hours according to specific activities.
Installation
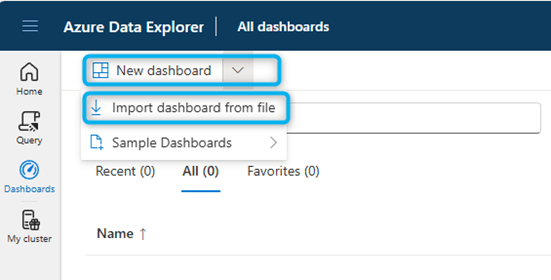
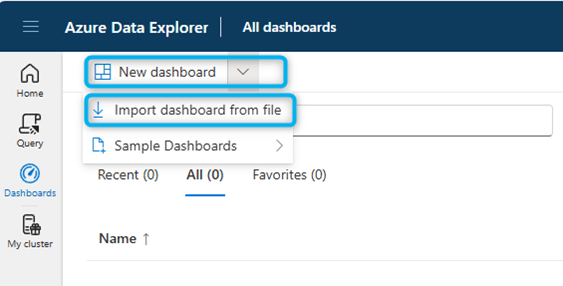
- Go to https://dataexplorer.azure.com/home
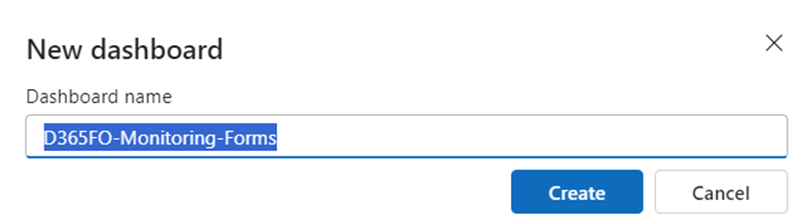
- Import the file “ADE-Dashboard-D365FO-Monitoring-Forms.json”.

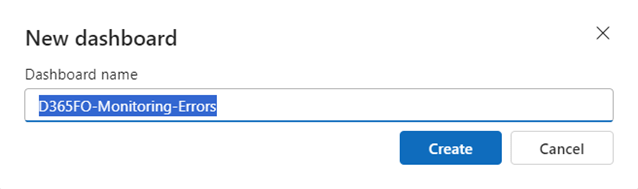
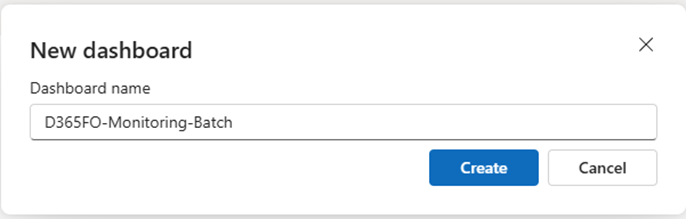
- Name the dashboard appropriately.
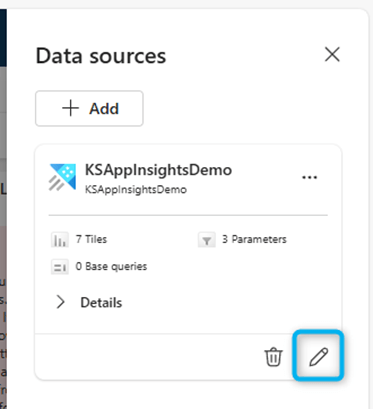
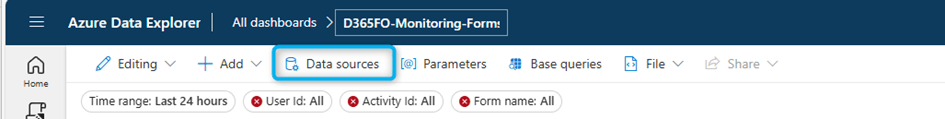
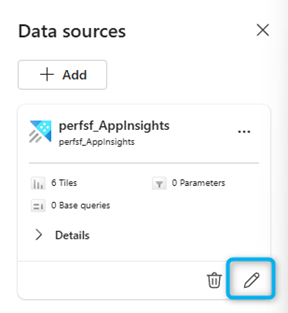
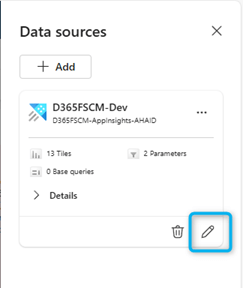
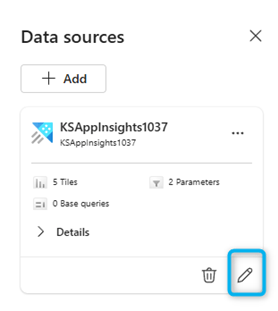
- Click to select data sources.

- There is a modeled data source with dummy placeholders. You need to replace it with your Azure subscription, resource group, and Application Insights instance.
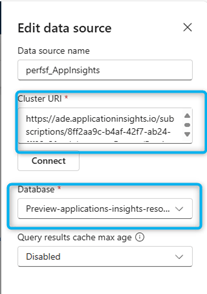
It is necessary to replace the Url cluster with the one related to our subscription by taking the value
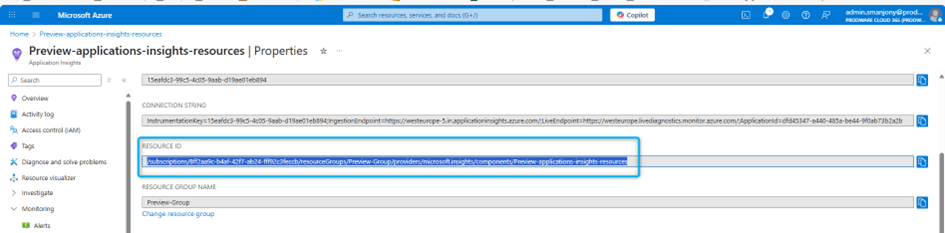
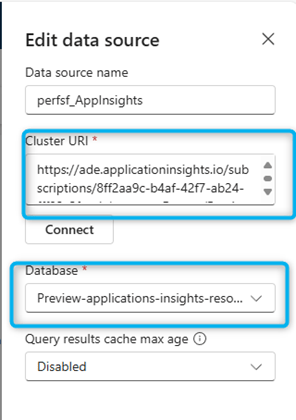
Then Click on Apply
X++ Exceptions
The platform captures and records all X++ layer exceptions in Application Insights.
This telemetry is used to:
- Monitor and diagnose errors to maintain the stability of the application.
- Track exception trends to identify recurring issues.
- Prioritize patches based on the frequency and severity of exceptions.
- Analyze the impact of exceptions on user tasks and workflows.
- Set alerts for specific exceptions in critical processes and spikes in global exception trends for quick response.
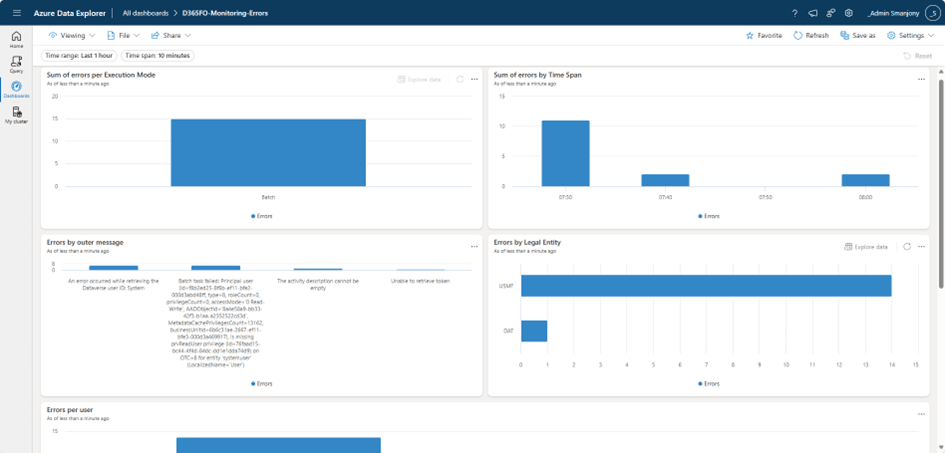
This dashboard displays information on errors reported by the environment. It allows:
- Study the nature and distribution of errors over time.
- Examine errors in environments
- Review the source of errors, grouping them by legal entity, type of reader and users
Installation
- Go to https://dataexplorer.azure.com/home
- Import the file “dashboard-D365FO-Monitoring-Errors.json”.
- There is a modeled data source with dummy placeholders. You need to replace it with your Azure subscription, resource group, and Application Insights instance.
It is necessary to replace the Url cluster with the one related to our subscription by taking the value

Then click on Apply.
Warehouse
Introduction
The warehouse module generates telemetry data.
These data allow to follow:
- Warehouse operations and workflows
- Performance indicators to identify and correct bottlenecks
It is necessary to use the provided Power BI dashboards to view telemetry.
Prerequisites
Supply Chain Management version: Telemetry with Application Insights requires Supply Chain Management version 10.0.29 or later.
Version of the Warehouse Management mobile app: Telemetry with Application Insights requires version 2.0.28 or later of the Warehouse Management mobile app.
Application Insights: You must have an Application Insights resource in Azure and configure your Supply Chain Management environment to send it telemetry data.
Power BI
The fastest and easiest way to view your warehouse telemetry is to download and configure the Power BI reports provided by Microsoft. Downloadable reports and configuration instructions are available at: https://github.com/microsoft/d365-scm-telemetry/tree/main/samples/PowerBI/Appsource
Application Insights
In Application Insights, telemetry data from Supply Chain Management tenants and the Warehouse Management mobile app are saved as custom events.
Sample Warehouse Management request : https://github.com/microsoft/d365-scm-telemetry/blob/main/samples/KQL/example_queries/WarehouseManagement.kql
Sample Warehouse Mobile Management request: https://github.com/microsoft/d365-scm-telemetry/blob/main/samples/KQL/example_queries/WarehouseMobileApp.kql
DMF Errors
The Data Management Framework (DMF) logs errors in the “Custom Events” table of Application Insights. Exceptions that go up to the X++ layer are recorded in the “Exceptions” table. Each logged error is associated with an error code: Data management errordescriptions and knownlimitations – Finance & Operations | Dynamics 365 | Microsoft Learn.
This telemetry is used to:
- Identify and solve integration problems
- Monitor the health of the data pipeline
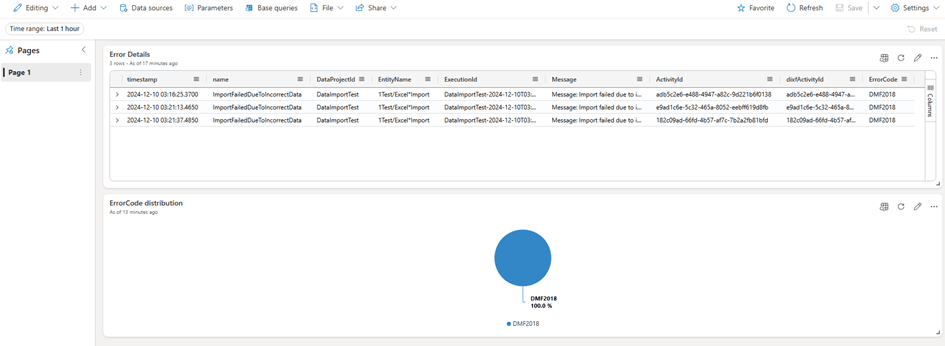
This dashboard displays information about DMF errors and their distribution in your solution. It allows us to identify:
- Breakdown of the different types of errors in your solution.
- ExecutionId, ActivityId and other details for errors in DMF
- Error message
Installation
- Go to https://dataexplorer.azure.com/home
- Import the file “dashboard-DMF Errors.json”.

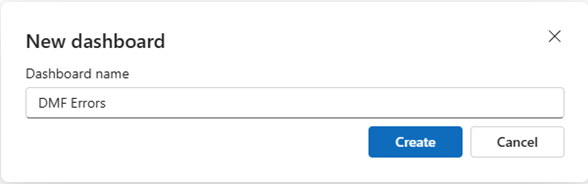
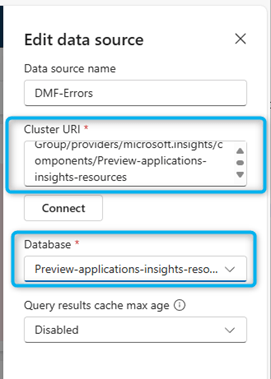
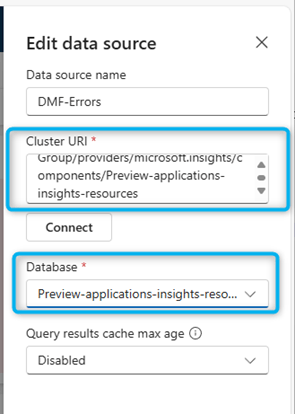
- Name the dashboard appropriately, then click to select data sources

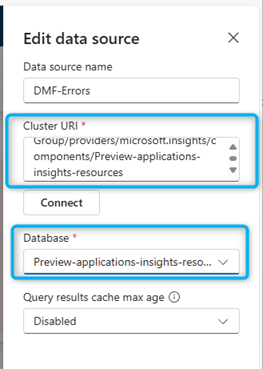
- In the data source selection pane, you need to place your Azure Application Insights subscription ID in the placeholder.
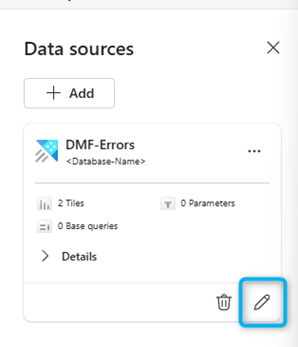
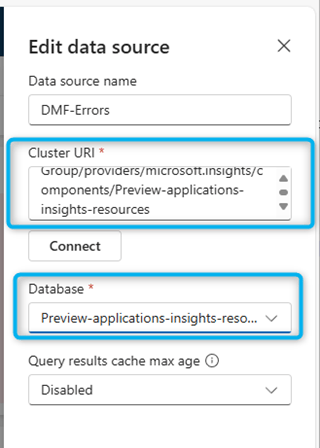
- After updating the correct subscription ID, click connect.
- You will get a list of databases. Select your Application Insights name from this list and save the changes.
- Your dashboard should now contain data. Do not hesitate to modify the requests according to your needs.
Batchs
The telemetry of the batches is recorded in the Custom Events table of your Azure Monitor Application Insights instance. For now, it is a preview feature available in 10.0.44 (build >= 7.0.7606.126), and 10.0.45 (build>= 7.0.7690.21)
To enable batch telemetry, enable the following flights:
- BatchTelemetryConfigurationFlight
- BatchThreadInfoTélémétrieVol
- BatchTelemetryCallstackFlight
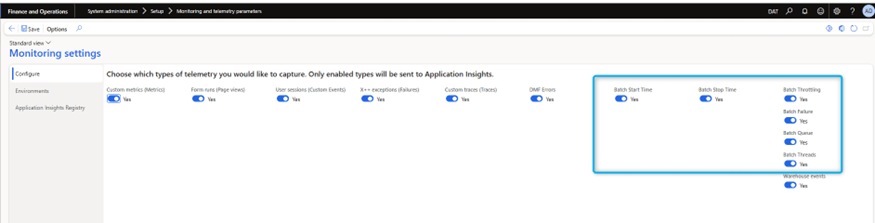
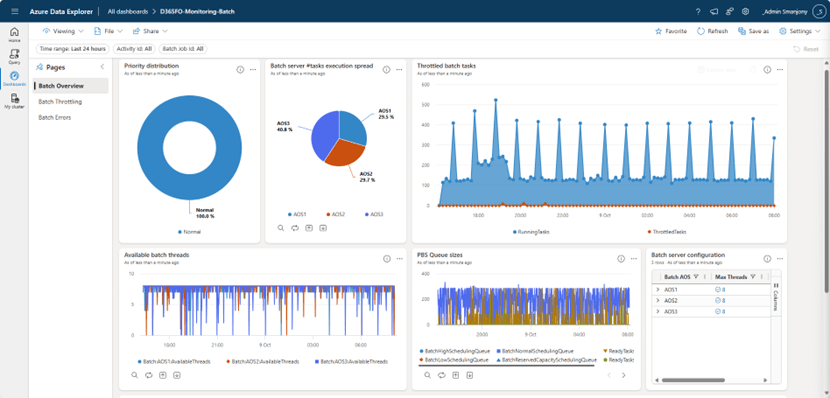
After activating the flights, new telemetry signals appear under the Configure tab:
- Batch start time: Records when a batch job starts.
- Batch stop time: Records the end of a task by batch. Tracking the duration. The start and end time of batch tasks: This is a crucial element of batch telemetry, as it allows us to calculate the execution time of tasks in batches
- Batch Throttling: Captures throttling events and associated system measurements (CPU, memory, SQL DTU).
- Batch Processing Failure: Adds diagnostic information when a task or batch job cannot be scheduled. It complements the existing Infolog errors by correlating the telemetry with the original batch job.
- Batch queue: Shows the queue sizes for different queues in the priority-based scheduling framework. Provides information about running threads. This allows customers to determine if a batch job has failed to start due to a lack of available threads on the AOS batch instances. For example, let’s query thread information to identify threads that are available to process batch workloads.
- Batch Threads – Displays active threads to help diagnose thread availability issues.
This telemetry is used to:
- Diagnose performance and planning bottlenecks
- Enable proactive monitoring via alerts and dashboards
- Accelerate the resolution of operational issues
Installation
- Go to https://dataexplorer.azure.com/home
- Import the file “ADE-Dashboard-D365FO-Monitoring-Batch”.
- Name the dashboard appropriately, then click to select data sources

- In the data source selection pane, you need to place your Azure Application Insights subscription ID in the placeholder.
- After updating the correct subscription ID, click connect.
- You will get a list of databases. Select your Application Insights name from this list and save the changes.
- Your dashboard should now contain data. Do not hesitate to modify the requests according to your needs.
Slow Query
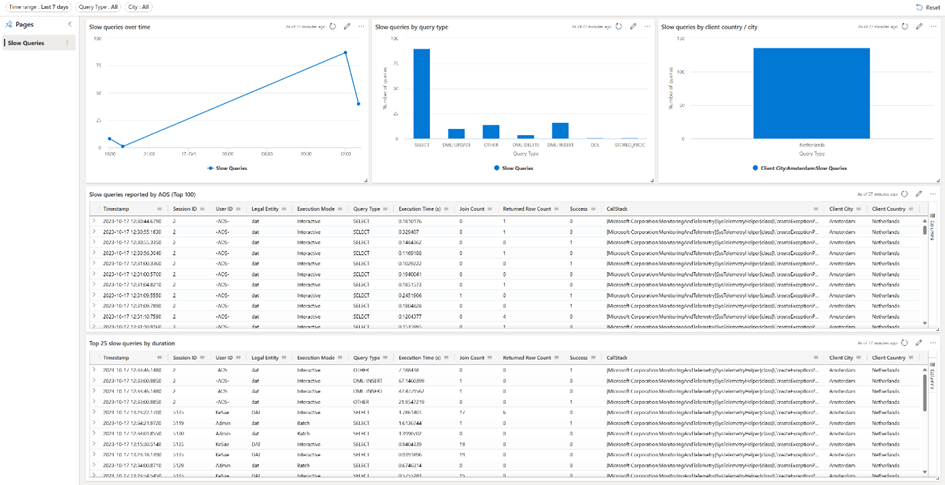
This dashboard displays information about slow requests reported by the AOS. It allows:
- Measure the number of slow requests over time.
- List slow by their duration.
- Investigate slow requests based on location.
Installation
- Go to https://dataexplorer.azure.com/home
- Import the file “ADE-Dashboard-D365FO-Monitoring-SlowQueries.json”.

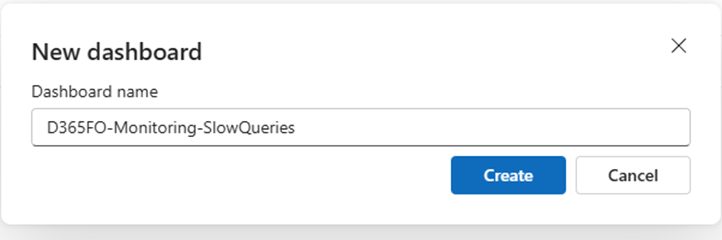
- Name the dashboard appropriately, then click to select data sources

- In the data source selection pane, you need to place your Azure Application Insights subscription ID in the placeholder.
- After updating the correct subscription ID, click connect.
- You will get a list of databases. Select your Application Insights name from this list and save the changes.
- Your dashboard should now contain data. Do not hesitate to modify the requests according to your needs.
Dual Write
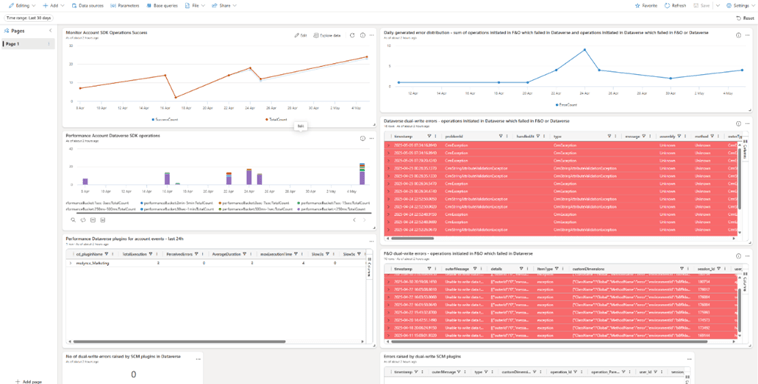
This dashboard consists of a single page with different tiles visualizing different signals related to dual write.
Through this dashboard, you can identify:
- Dual write errors in Dataverse
- Clerical errors in D365 Finance
- Number of errors and details of the errors generated by the SCM plug-ins
- Distribution of errors generated daily by Dual write
- Success rate of the Monitor account SDK
- Account SDK Dataverse operations performance
Installation
- Go to https://dataexplorer.azure.com/home
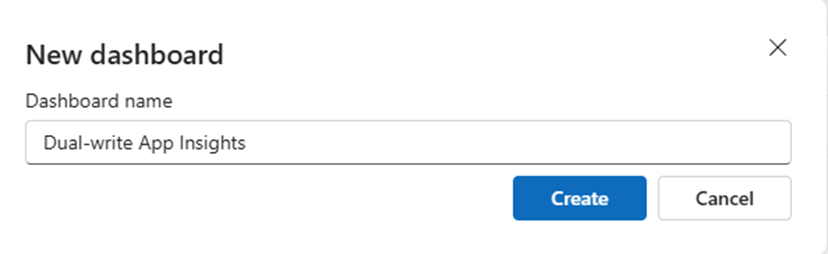
- Import Files: « dashboard-Dual-write App Insights.json»

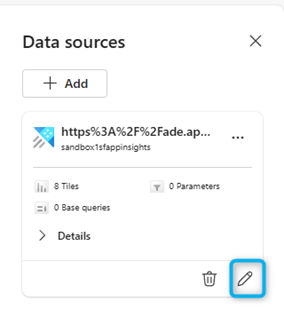
- Name the dashboard appropriately, then click to select data sources

- In the data source selection pane, you need to place your Azure Application Insights subscription ID in the placeholder.
- After updating the correct subscription ID, click connect.
- You will get a list of databases. Select your ApplicationInsights name from this list and save the changes.
- Your dashboard should now contain data. Do not hesitate to modify the requests according to your needs.

Leave a comment