- Introduction
- Background and stakes
- What changes?
- Solution architecture
- Why it matters
- Prerequisites
- Enabling the feature flights
- Telemetry signals — detailed view
- Ready-to-use KQL queries
- DMF Accelerator dashboard
- Installation
- Setting up alerts
- Recommended KPIs and indicators
- Best practices
- Limitations and watch-outs
- Conclusion
Introduction
Microsoft has rolled out the integration of DMF telemetry with Application Insights. A real game-changer for everyone who has ever stared at a stuck data import wondering, “where exactly is this failing?”
Until now, monitoring DMF integrations relied mostly on the Job History form inside D365, with very limited correlation against the underlying Azure infrastructure. Operations and Integration teams were stuck doing post-mortem analysis, batch alert emails, and manual extracts. This new native integration with Application Insights finally aligns DMF monitoring with Azure Monitor’s unified observability strategy.
Background and stakes
The Data Management Framework is the backbone of most integrations between Dynamics 365 Finance & Supply Chain Management and the broader IT ecosystem: legacy ERPs, CRMs, Data Lakes, EDI platforms, B2B partners, MDM. As such, it concentrates a significant share of operational risk: a stuck invoice import, an unsent sales order export, or an interrupted master data load can freeze entire process chains.
Historical limitations of DMF monitoring
- Visibility limited to the “Job History” screen in D365, hard to leverage for time-based or comparative analysis.
- No way to correlate with infrastructure metrics (CPU, RAM, SQL DTUs, Service Bus queues) managed in Azure Monitor.
- Reactive alerting based on batch notification emails, with no aggregation or advanced thresholding.
- No consolidated cross-environment indicator (Sandbox, UAT, Production), especially in shared contexts.
- High investigation cost on failure: log dumps, CSV extracts, manual query runs.
The Application Insights integration directly addresses these gaps by bringing DMF telemetry into the standard Azure observability stack (Log Analytics, KQL, Workbooks, Action Groups).
What changes?
The Data Management Framework (DMF) now benefits from first-class observability through Application Insights. Your import/export jobs, data entities, and staging area performance generate structured telemetry that you can query, visualize, and turn into alerts — fully aligned with the rest of your Azure monitoring stack.
Concretely, DMF events are emitted by the AOS (Application Object Server) via the Application Insights SDK and stored in the customEvents (and traces / exceptions, depending on severity) table of the Log Analytics workspace attached to your Application Insights resource. The data becomes immediately accessible through KQL and consumable in Azure Monitor Workbooks, Power BI, or Azure Data Explorer dashboards.
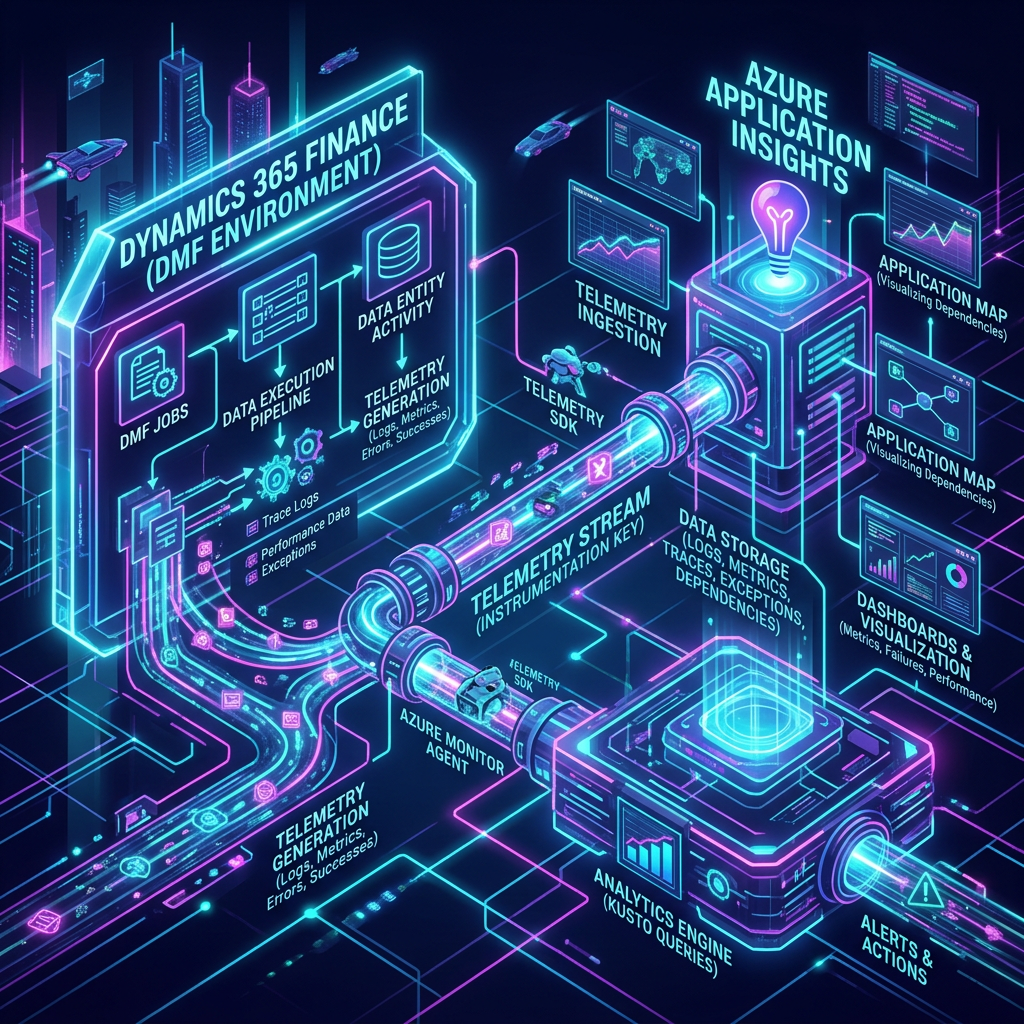
Solution architecture
The telemetry flow follows the architecture below:
- D365 F&SCM (AOS) — The DMF engine emits structured events on every job state transition (start, per-staging-step status, end).
- Application Insights — Receives the events through the connection string configured in LCS at the environment level.
- Log Analytics Workspace — Stores events in the customEvents, traces, and exceptions tables, with configurable retention (30 days by default).
- Visualization layers — Azure Data Explorer Dashboard (DMF Accelerator), Azure Monitor Workbooks, Power BI, or Grafana depending on team preferences.
- Alerting layer — Azure Monitor Alert Rules + Action Groups to notify Teams, email, SMS, or trigger an ITSM webhook (ServiceNow, Jira).
The target Application Insights resource is configured per environment via Microsoft Dynamics Lifecycle Services (LCS), under Maintain > Application Insights configuration. A connection string is recommended over the (deprecated) instrumentation key.
Why it matters
- No more opaque DMF jobs! Identify slowdowns, failures, and root causes.
- Proactive alerts on data integration failures rather than reactive incident handling.
- Correlate DMF performance with system-wide telemetry in a single pane of glass.
- Better capacity planning for high-volume data loads.
- Industrialized monitoring: business-shareable KPIs, measurable SLAs, compliance-grade audit trail.
Prerequisites
Before enabling DMF telemetry, verify the following:
| Category | Requirement |
| Environment type | Tier-2 environment or higher (Quality Sandbox, Standard Acceptance Test, Production). Not available on Tier-1 (Cloud Hosted Dev). |
| D365 version | Application version 10.0.39+ recommended (verify flight availability in your region). |
| Azure resource | A Workspace-based Application Insights resource (do not use Classic mode, deprecated since February 2024). |
| LCS | Configuration rights on the environment (Environment Manager role) to set the connection string. |
| Azure RBAC | Reader role (KQL read access) or Monitoring Reader on the App Insights resource for analysts; Contributor for administrators. |
| Feature flights | DMFTelemetryConfigurationFlight and DMFEnableAppInsightsLogsAndErrors enabled by Microsoft Support through an LCS service request. |
| Network | Outbound HTTPS allowed to *.applicationinsights.azure.com / *.in.applicationinsights.azure.com endpoints. |
Enabling the feature flights
DMF telemetry is controlled by the following two flights:
- DMFTelemetryConfigurationFlight
- DMFEnableAppInsightsLogsAndErrors
If these flights are not enabled in your environment, contact Microsoft Support through an LCS service request. Activation is per-environment (production and sandbox are independent) and typically requires an AOS restart.
Once the flights are enabled, new telemetry signals appear in the Data Management workspace under the Configure tab:
- DMFJob Start — Logs when a DMF job starts.
- DMFJob End — Logs when a DMF job ends.
- DMFJob Status — Logs job status from source to staging tables and staging to target tables.
Telemetry signals — detailed view
Each DMF event lands in the customEvents table of Application Insights, with a name and a customDimensions dictionary. The main exposed properties are:
| Property | Description |
| jobId | Unique identifier of the DMF job execution (correlates with D365 Job History). |
| jobDefinition | Name of the import/export project configured in the Data Management workspace. |
| executionId | Batch execution ID (useful for tying to D365 batch traces). |
| environmentId | GUID of the source environment (essential in multi-environment setups). |
| entityName | Name of the data entity being processed (CustGroup, VendInvoice, …). |
| recordCount | Number of rows processed (source → staging and staging → target). |
| duration | Step duration in milliseconds. |
| status | Success / Failed / PartiallyFailed / Cancelled. |
| errorMessage | Detailed message in case of failure (also surfaced in the exceptions table). |
| stagingStep | SourceToStaging or StagingToTarget. |
Worth noting: a single job typically produces 1 Start event, multiple Status events (one per staging step and per entity), and 1 End event. For complex multi-entity projects, expect dozens of events per execution.
Ready-to-use KQL queries
The following Kusto queries can be run directly in your Application Insights Logs blade or in Azure Data Explorer.
1. Top 10 longest DMF jobs over the last 7 days
| customEvents | where timestamp > ago(7d) | where name == “DMFJob End” | extend duration = toint(customDimensions.duration) | extend jobDefinition = tostring(customDimensions.jobDefinition) | project timestamp, jobDefinition, duration, jobId = tostring(customDimensions.jobId) | top 10 by duration desc |
2. Failure rate by data entity
| customEvents | where timestamp > ago(30d) | where name == “DMFJob End” | extend entity = tostring(customDimensions.entityName) | extend status = tostring(customDimensions.status) | summarize total = count(), failed = countif(status == “Failed” or status == “PartiallyFailed”) by entity | extend failureRate = round(100.0 * failed / total, 2) | order by failureRate desc |
3. Daily processed row volume
| customEvents | where timestamp > ago(30d) | where name == “DMFJob Status” | extend rows = toint(customDimensions.recordCount) | summarize totalRows = sum(rows) by bin(timestamp, 1d) | render timechart |
4. Detect stuck jobs (Start without matching End)
| let starts = customEvents | where timestamp > ago(24h) and name == “DMFJob Start” | extend jobId = tostring(customDimensions.jobId) | project jobId, startTime = timestamp; let ends = customEvents | where timestamp > ago(24h) and name == “DMFJob End” | extend jobId = tostring(customDimensions.jobId) | project jobId, endTime = timestamp; starts | join kind=leftanti ends on jobId | where startTime < ago(1h) |
5. Correlate DMF errors with AOS exceptions
| exceptions | where timestamp > ago(7d) | where customDimensions has “DMF” | project timestamp, problemId, type, outerMessage, jobId = tostring(customDimensions.jobId) | order by timestamp desc |
DMF Accelerator dashboard
Microsoft FastTrack provides an Azure Data Explorer dashboard to visualize DMF execution telemetry from Dynamics 365 Finance & Supply Chain Management.
This release (https://github.com/microsoft/Dynamics-365-FastTrack-FSCM-Telemetry-Samples/releases/tag/DMF-1.0.0.3) includes the following telemetry:
- DMF job start and end times.
- DMF job status events.
- DMF-related error messages.
It also lets you use the environmentId parameter to filter data coming from different environments that may share the same Application Insights / Log Analytics workspace — a common pattern in multi-tenant or multi-customer architectures.
Installation
Step 1: Open Azure Data Explorer at https://dataexplorer.azure.com/home.
Step 2: Import the file “dashboard-D365FO-Monitoring-DMF.json”.
Step 3: Name the dashboard and click Data sources.
Step 4: In the data source selection pane, paste your Azure Application Insights subscription ID into the placeholder.
 |  |
Step 5: Once the subscription ID is set, click Connect.
Step 6: You’ll see a list of databases. Select your Application Insights name from the list, then save.
Step 7: Your dashboard should now display data. Feel free to adjust the queries to match your needs.
Setting up alerts
The Application Insights integration lets you build Azure Monitor alerts based on KQL queries (Log Search Alerts). Common recommended alerts include:
| Alert | Condition | Severity |
| Critical job failure | DMFJob End with status = Failed on a job tagged “critical” by name | Sev 1 — Critical |
| Partially failed job | status = PartiallyFailed (rows not imported) | Sev 2 — Error |
| Abnormal duration | duration > 2x historical median for the entity | Sev 3 — Warning |
| Out-of-range volume | recordCount < min_threshold or > max_threshold expected | Sev 3 — Warning |
| Stuck job | Start without matching End after 1 hour | Sev 2 — Error |
| Error spike | More than 10 DMF exceptions in 5 minutes | Sev 2 — Error |
Notifications are routed via an Azure Monitor Action Group: email, SMS, Azure mobile push, Teams message via webhook, or automatic ITSM ticket creation (ServiceNow, Jira Service Management, Cherwell). For critical jobs, dual routing is recommended: Teams for operational responsiveness + ITSM for traceability.
Recommended KPIs and indicators
To steer DMF integration performance, track the following weekly or monthly indicators:
| KPI | Definition | Target |
| DMF success rate | % of jobs with status = Success over total | >= 99% (critical jobs) |
| Average duration per entity | Average duration by jobDefinition + entityName | Baseline + 1 standard deviation |
| Throughput (rows/s) | recordCount / (duration/1000) | Stable over time |
| End-to-end latency | Delay between source file arrival and target job completion | Per business SLA |
| Mean Time To Recovery (MTTR) | Average time between failure detection and resolution | < 1 hour (critical) |
| Monthly volume ingested | Sum of recordCount over a rolling 30-day window | Compare against capacity |
Best practices
App Insights architecture choices
- Prefer a Log Analytics workspace dedicated to D365 over one shared with other workloads, to simplify RBAC and cost control.
- Use Workspace-based mode (mandatory since February 2024; Classic mode is deprecated).
- Group Sandbox + Production into the same workspace and discriminate via the environmentId column — it makes comparisons and baseline rollovers easier.
Cost management
- Application Insights is billed per GB ingested (Pay-As-You-Go) or via Commitment Tiers. DMF volumes can be significant: budget 1 to 5 GB/day depending on integration intensity.
- Enable Application Insights sampling (adaptive by default) for high-frequency events.
- Set differentiated retention policies: 30 days on customEvents, 90 days on critical exceptions, long-term archival to Azure Storage if compliance requires.
- Export cold data via Diagnostic Settings to a Cool/Archive storage account.
Governance and compliance
- Never include PII (customer names, personal identifiers) in job names or jobDefinition values — these come through unencrypted in telemetry.
- Enforce a DMF project naming convention: <Domain>_<Direction>_<Entity>_<Type> (e.g., SALES_FR_CustInvoice_Import).
- Document the App Insights connection string in the CMDB and architecture documentation.
- Periodically review Action Groups (rotate contacts, update webhooks).
Limitations and watch-outs
- Ingestion latency: 2 to 5 minutes on average between event emission by the AOS and visibility in Log Analytics. Account for this in near-real-time alerts.
- Scope limited to DMF batch jobs: interactive runs (manual import via the UI) are not consistently captured.
- No native telemetry on staging-side mapping transformations (internal framework performance remains partly opaque).
- Costs to anticipate: a heavily integrated production environment can generate several GB/day; validate the budget dimension with Finance.
- Geographic availability: confirm that the Azure region of the Application Insights resource complies with sovereignty constraints (e.g., France Central for French data).
- Feature flight coupling: telemetry stays silent until Microsoft enables the flights. Plan the support request 2 to 3 weeks ahead of go-live.
Conclusion
If you manage Finance integrations, this is something you should anticipate. Integrating DMF telemetry with Application Insights is a major step forward to harden data pipelines, professionalize monitoring, and industrialize the relationship between Run, Build, and business teams.
Start planning your Application Insights workspace and define the key performance indicators (KPIs) you want to track: import duration, row count, error rate, MTTR, end-to-end latency.
Immediate action checklist
- Identify or provision a Workspace-based Application Insights resource dedicated to D365.
- Open a Microsoft Support ticket to enable both DMF flights.
- Configure the connection string in LCS for every Tier-2+ environment.
- Import the DMF Accelerator dashboard into Azure Data Explorer.
- Define 3 to 5 initial alerts (critical failure, stuck job, error spike).
- Establish a 30-day baseline of durations and volumes per entity.
- Share the KPIs with the relevant business directorates (Finance, Supply Chain, Accounting).

Leave a comment